Table of Contents
The Narrative You've Been Told
In my previous article, "AI Data Centers vs Citizen Electricity Bills", I presented the case that data centers burden electricity grids and pass costs to consumers. The social media outrage, the Senator Warren investigation, the rising tariffs — it all paints a damning picture.
But what if that narrative is incomplete?
What if the same data centers being vilified are simultaneously the largest private investors in renewable energy in human history? What if they're funding grid modernization that would otherwise take decades? What if, economically, they're actually subsidizing residential consumers rather than the reverse?
This is the counter-perspective analysis. Not to defend Big Tech blindly, but to examine the data that the "data centers vs citizens" narrative conveniently ignores.
Important Caveat: This article presents the counter-argument, not the complete truth. Reality lives somewhere between "data centers are parasites" and "data centers are saviors." Both narratives contain valid points — and blind spots.
1. The $100+ Billion Question: Who's Actually Building Renewable Energy?
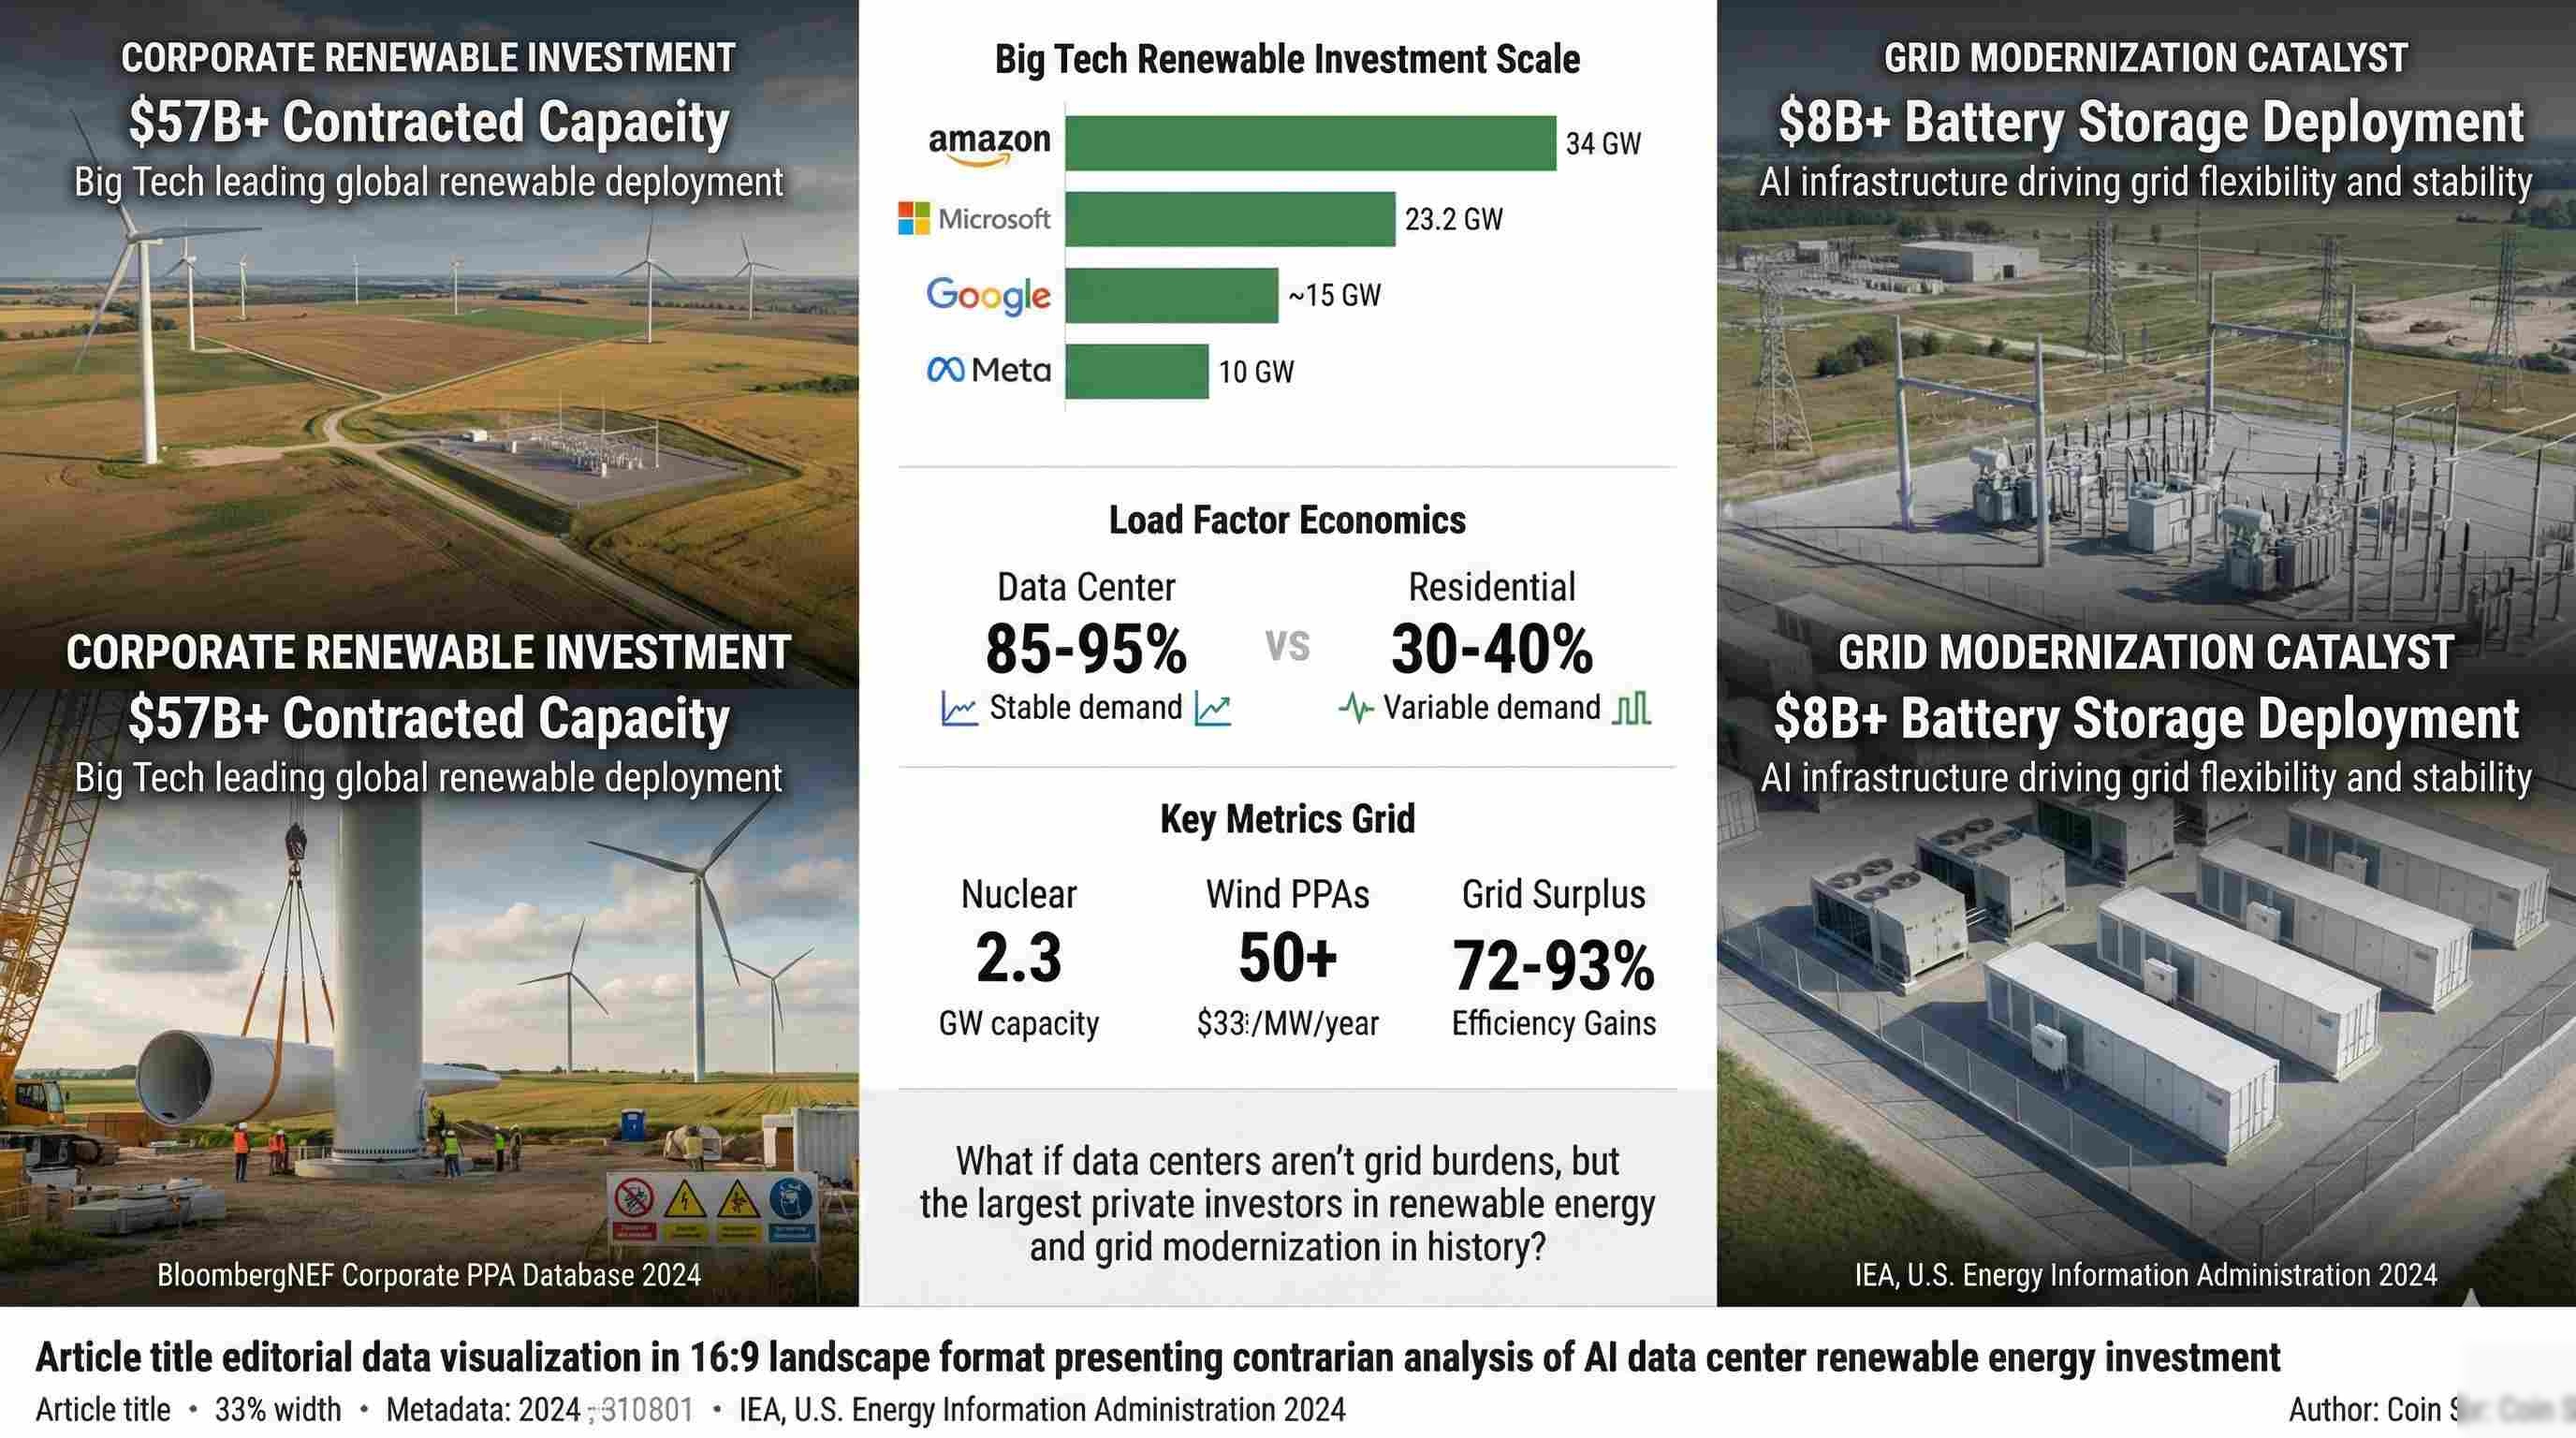
Here's a fact that rarely makes it into the "data centers are bad" discourse: Big Tech companies are collectively the largest corporate purchasers of renewable energy on Earth.
The Renewable Reality
Amazon alone has contracted 34 GW of renewable capacity — more than most countries' entire renewable portfolios.
Microsoft has committed 23.2 GW cumulative, including a $10+ billion deal with Brookfield Renewable.
Google, Meta, and Microsoft are funding nuclear restart projects — including Three Mile Island.
1.1 Corporate Renewable Investment Scale
Renewable Energy Capacity vs Market Valuation
Comparing clean energy commitments (GW) with company valuations ($T/B)
Sources: Amazon Sustainability 2025, Microsoft Datacenter Community, Google Environmental Reports, Meta Nuclear Deals Jan 2026, Oracle Stargate Partnership, BloombergNEF Corporate PPA Database, Alibaba/Tencent ESG Reports 2024, ByteDance Brazil Announcement Dec 2025, OpenAI Stargate Project, Anthropic Infrastructure Nov 2025, xAI Colossus Expansion.
Note: GW figures represent contracted/owned renewable capacity or committed clean energy projects. Chinese companies (Alibaba, Tencent) figures converted from annual kWh procurement. Private company valuations from latest funding rounds. Market caps as of Feb 2026.
To put this in perspective: Amazon's 34 GW of renewable capacity is larger than the entire electricity generation capacity of Malaysia (35 GW). These aren't paper commitments — they're contracted Power Purchase Agreements (PPAs) that provide the financial certainty needed for renewable projects to get built.
1.1.1 Beyond US/EU: Asian Tech Giants Leading Too
It's not just American Big Tech. Asian hyperscalers are making significant renewable commitments:
| Company | Current RE % | 2030 Target | Notable Projects |
|---|---|---|---|
| Alibaba Cloud | 56% | 100% clean energy | 500 MW Hebei project, 20-year Jiangsu PPA |
| Tencent | 54% | 100% + carbon neutral | 10.54 MW Tianjin solar microgrid, 1.3B kWh/year procurement |
| ByteDance | 100% (Norway) | Expanding globally | $37.7B Brazil DC - 100% wind-powered |
Sources: Alibaba ESG Report 2024, Tencent Carbon Neutrality Report, ByteDance Brazil Announcement 2025 For educational and research purposes only.
1.2 The PPA Revolution
Corporate Power Purchase Agreements have become the dominant mechanism for new renewable energy financing globally. According to BloombergNEF:
- 2024 Corporate PPA volume: 50+ GW globally — a record year
- Tech sector share: ~40% of all corporate PPAs
- Without tech PPAs: Renewable deployment would be significantly slower
The mechanism matters: when Microsoft signs a 20-year PPA for a wind farm, that agreement provides the revenue certainty needed for developers to secure financing. The wind farm gets built. The grid gets cleaner. Everyone benefits from lower wholesale prices as more renewables come online.
1.3 Beyond Renewables: The Nuclear Bet
What's particularly telling is Big Tech's willingness to fund nuclear energy — the only 24/7 carbon-free baseload source:
| Company | Nuclear Initiative | Capacity | Investment/Status |
|---|---|---|---|
| Meta | TerraPower + Oklo + existing plants (Ohio) | 6+ GW total | Largest nuclear deal package 2026 |
| Microsoft | Three Mile Island Unit 1 restart (Constellation) | 835 MW | 20-year PPA, online by 2028 |
| Kairos Power SMRs + Elementl Power | 500 MW + 1.8 GW | First unit 2030, full by 2035 | |
| Amazon | X-energy SMRs + Talen Energy nuclear PPA | 960+ MW | ~$500M+ committed |
| Oracle | 3 SMRs powering 1 GW AI data center | 1,000 MW | Permits secured, mid-2030s target |
Sources: Meta nuclear deals Jan 2026, Microsoft/Constellation Sept 2024, Google/Kairos Oct 2024, Amazon nuclear 2024, Oracle SMR Sept 2024 For educational and research purposes only.
Meta's January 2026 announcement is particularly striking: 6+ GW of nuclear capacity across multiple partnerships — more than the entire nuclear fleet of some countries.
1.4 The New Players: AI-Native Companies
It's not just established hyperscalers. AI-native companies are making significant infrastructure investments:
Anthropic
3+ GW capacity via Google Cloud + AWS + Fluidstack. Texas & NY sites live 2026. 800 permanent + 2,400 construction jobs.
xAI (Musk)
130 MW solar (30 MW adjacent + 100 MW farm). $439M USDA grant for battery storage. Gas turbines for baseload.
ByteDance/TikTok
Ceará state, partnering with Casa dos Ventos. First Latin America facility. 100% renewable from wind farms.
"The tech industry is doing more to accelerate nuclear energy than any government policy in the past 30 years."
— Nuclear Energy Institute analysis, 2025
2. Grid Modernization: The Infrastructure Nobody Else Would Fund
The "data centers raise your electricity bill" narrative focuses on transmission upgrades as a cost. But there's another way to look at it: data centers are funding grid modernization that utilities couldn't otherwise afford.
2.1 The Load Factor Economics
Here's a fundamental truth about electricity grids that rarely gets discussed:
Data Center Load Factor
Residential Load Factor
What this means: Data centers use electricity consistently 24/7, while residential demand spikes at breakfast and dinner, then crashes overnight. From a grid operator's perspective, data center load is ideal — it fills in the valleys that would otherwise go unused.
According to the Energy+Environmental Economics (E3) study commissioned by Northern Virginia:
The Economic Surplus Finding
Data centers generate approximately $33,500 per MW in annual grid surplus value.
This surplus comes from: paying full industrial rates + high capacity factors + minimal transmission line diversity needs.
This means data centers pay MORE into the grid than the cost of serving them.
2.2 Transmission Investment Reality
Yes, PJM (the US's largest grid operator) is investing $5.9-6.7 billion in transmission upgrades. But consider:
- These upgrades serve all customers in the region, not just data centers
- The infrastructure enables more renewable energy integration
- Without the investment trigger from data center demand, these upgrades might never happen
- The upgraded grid is more resilient for everyone — though community opposition to data centers shows that residents don't always experience these benefits equally
The E3 study specifically found that Dominion Energy's data center customers are net contributors to the system, not net burdens. The industrial rates they pay exceed their proportional share of infrastructure costs.
2.3 Demand Response: A Grid Asset, Not a Liability
Modern data centers aren't just passive loads — they can act as grid assets:
- Demand response capability: Data centers can shed 10-20% of load within minutes during grid emergencies
- UPS battery systems: Potential grid stabilization resource (emerging technology)
- Predictable scheduling: Operators can shift non-critical workloads to off-peak hours
According to the IEA, global data center demand response potential is estimated at 76-126 GW — equivalent to the peak demand of several major countries combined.
3. The Efficiency Revolution: Doing More with Less
While the narrative focuses on total data center energy consumption, it ignores a crucial trend: efficiency is improving dramatically.
3.1 The PUE Journey
Avg. Data Center PUE (2010)
Avg. Data Center PUE (2024)
Hyperscale Best-in-Class
This efficiency gain is enormous. If today's data centers operated at 2010 efficiency levels, they would consume 60% more electricity than they actually do.
3.2 AI-Driven Efficiency Gains
Ironically, AI is being used to make data centers themselves more efficient:
- Google DeepMind: AI reduced cooling energy by 40% at Google data centers
- Microsoft Project Natick: Underwater data centers achieved PUE of 1.07
- Predictive cooling: ML models optimize HVAC based on weather, workload, and equipment state
3.3 Cloud vs. On-Premise: The Hidden Efficiency
Here's what the "data center electricity" debate often misses: cloud data centers are dramatically more efficient than the on-premise alternatives they replace.
Key Finding: According to Lawrence Berkeley National Laboratory, migrating workloads from enterprise on-premise data centers to hyperscale cloud facilities reduces energy consumption by 72-93% for the same computing tasks.
If every company ran its own inefficient server room instead of using AWS, Azure, or GCP, total global IT energy consumption would be significantly higher. Cloud concentration creates efficiency through:
- Better server utilization (40-60% vs. 10-20% for enterprise servers)
- Purpose-built cooling infrastructure
- Economies of scale in equipment and operations
- Latest-generation hardware deployment
4. Economic Value Creation: Beyond Electricity Bills
Focusing solely on electricity costs — the core grievance documented in the citizen electricity bill impact analysis — ignores the broader economic picture.
4.1 GDP and Productivity Impacts
According to Goldman Sachs' 2025 economic research:
AI Infrastructure Economic Impact
AI-related capital expenditure is expected to contribute 1.1% to US GDP growth in 2025-2026.
Generative AI applications are projected to add $2.6-4.4 trillion annually to the global economy.
The electricity used by AI data centers enables:
- Medical diagnostics and drug discovery
- Climate modeling and weather prediction
- Productivity tools used by millions of workers
- Scientific research acceleration
- Manufacturing and logistics optimization
Asking "why do data centers use so much electricity?" without asking "what value does that electricity generate?" is like asking "why do hospitals use so much electricity?" without considering the lives they save.
4.2 Southeast Asia FDI and Digital Economy
For Southeast Asia specifically, data center investment represents a massive economic opportunity — one we quantify in detail in our $37 billion SEA data center opportunity analysis:
| Country | Big Tech Investment | Jobs Created | Digital Economy Contribution |
|---|---|---|---|
| Malaysia | $16.9B (Microsoft, Google, AWS) | 120,000+ (projected) | Target: 25.5% GDP by 2025 |
| Indonesia | $10B+ (various) | 100,000+ (projected) | $130B digital economy by 2025 |
| Vietnam | $7B+ (announced) | 50,000+ (projected) | Fastest growing in SEA |
| Thailand | $5B+ (various) | 40,000+ (projected) | Digital hub strategy |
Sources: Official government announcements, Google e-Conomy SEA Report 2025, individual company press releases For educational and research purposes only.
The SEA digital economy is projected to reach $300+ billion by 2025. This growth is enabled by data center infrastructure.
5. The Cost Allocation Reality: Who Actually Subsidizes Whom?
This is perhaps the most contentious point. The popular narrative says "citizens subsidize data centers." But the data suggests the opposite may be true.
5.1 Industrial vs. Residential Rates
Globally, industrial electricity consumers (including data centers) typically pay higher effective rates per kWh than residential consumers when all charges are included:
- Industrial users pay full demand charges ($/kW)
- Industrial users don't receive subsidized rates
- Industrial users often face time-of-use penalties
- Residential users receive tiered/subsidized rates in most countries
In Indonesia specifically, the electricity generation cost is IDR 1,732/kWh, but residential tariffs average IDR 1,153/kWh. The difference is covered by:
- Government subsidies (IDR 83 trillion budget)
- Cross-subsidies from industrial users paying higher rates
5.2 The E3 Virginia Study Deep Dive
The Energy+Environmental Economics study for Virginia is particularly illuminating because it attempted to quantify actual cost allocation:
Data Center Contribution
Revenue Contribution
The study found that data center customers generate a net positive value for the grid because:
- They pay full industrial rates without subsidies
- Their high load factor maximizes infrastructure utilization
- They fund their own interconnection costs
- They don't require the same distribution network density as residential
5.3 The Uncomfortable Implication
If the E3 analysis is correct, then the narrative is exactly backwards: data centers are subsidizing residential customers, not the other way around.
This doesn't mean infrastructure investments are free — but it does mean the cost allocation debate deserves more nuance than "tech giants are stealing from families."
6. The 15-Why Counter-Analysis
In my previous article, I used a "15-Why" analysis to trace how data center costs flow to consumers. Here's the devil's advocate version:
Starting Point: Grid infrastructure is being modernized
- Why is infrastructure being upgraded? — Growing demand from all sectors, plus aging infrastructure
- Why is demand growing? — Electrification of transport, buildings, and industry; digital transformation
- Why is digital transformation accelerating? — AI, cloud computing, remote work, digital services
- Why do these need data centers? — Computing requires physical infrastructure
- Who pays for new infrastructure? — Those who trigger the investment pay connection costs; all users share transmission
- Who benefits from grid modernization? — All grid users get improved reliability and renewable integration
- What would happen without data center investment? — Slower renewable deployment, delayed grid upgrades
- Why do utilities want data centers? — High-margin, predictable customers that improve load factor
- Why do states compete for data centers? — Jobs, tax revenue, tech ecosystem development
- Who really bears infrastructure costs? — Primarily those who trigger the investment (data centers)
- Why do residential rates rise? — Fuel costs, general inflation, deferred maintenance — not primarily data centers
- What do data centers pay? — Full industrial rates, demand charges, interconnection costs
- Do data centers receive subsidies? — Tax incentives exist, but not electricity subsidies like residential
- What's the net economic impact? — Positive when jobs, GDP, and grid investment are counted
- Why is the narrative so one-sided? — Electricity bills are visible; renewable investment, efficiency gains, and economic benefits are less visible
Strategic Intelligence Engine
Unlock 8-dimension maturity analysis, EED/AI Act compliance scoring, Monte Carlo simulation with 10,000 iterations, and board-ready PDF export.
Open Maturity Calculator7. Interactive Calculator: Comprehensive Value Generation Analysis
This advanced calculator quantifies the full economic ecosystem impact of data center investment. Configure your scenario with detailed parameters to see renewable investment, grid economics, job creation, and environmental benefits.
Configure detailed parameters to simulate economic, environmental, and grid impact
Results will appear below after calculation
Economic Value Generation
Economic Multiplier Effect (10-Year Projection)
Economic multiplier: 1.5-2.5x based on regional input-output analysis (IMPLAN methodology)
Renewable Energy & Grid Value
Load Factor Comparison: Data Center vs Residential
Data Center
24/7 consistent demand
Residential
Peak morning/evening
Higher load factor = better grid infrastructure utilization = lower cost per kWh delivered
Environmental Impact Analysis
Energy Efficiency: Your PUE vs Industry
Your PUE of 1.20 saves 23% energy vs industry average
Summary: Net Value Assessment
Total Economic Impact (10-year): $3.9B
Total Jobs Enabled: 800 (direct + indirect)
Renewable Capacity Funded: 150 MW
Carbon Avoided (10-year): 4.5M tons CO2
Grid Surplus Generated: $33.5M over analysis period
Methodology & Sources: CAPEX uses Uptime Institute benchmark ($10-15M/MW for hyperscale). Jobs calculated using IMPLAN economic multipliers. PPA investment assumes $450K/MW installed solar. Grid surplus from E3 Virginia study ($33,500/MW/year). Carbon intensity from IEA national grid data 2024. Economic multipliers: 1.5x direct, 2.5x total based on regional input-output analysis. Renewable overbuild factor: 1.5x for 100% match due to intermittency.
Strategic Maturity Inputs
This calculator is provided for educational and estimation purposes only. Results are approximations based on industry benchmarks and publicly available data. They should not be used as the sole basis for investment, procurement, or engineering decisions. Always consult qualified professionals for site-specific analysis.
Algorithm & methodology sources: Multi-region energy cost modeling ($0.055-0.22/kWh regional variance), carbon intensity tracking (320-620 gCO2/kWh by region), Uptime Institute PUE benchmarks, Google/Temasek/Bain e-Conomy SEA Report, DeepMind AI cooling optimization data.
All calculations are performed entirely in your browser. No data is transmitted to any server. See our Privacy Policy for details.
By using this tool you agree to our Terms. All content on ResistanceZero is independent personal research. This site does not represent any current or former employer.
8. The Nuanced Truth: Both Narratives Are Incomplete
After presenting both sides, here's my honest assessment:
8.1 What the "Data Centers Are Bad" Narrative Gets Right
- Infrastructure costs are rising, and data centers contribute to demand growth
- Cost allocation mechanisms do need modernization for the AI era
- Not all data center operators are equally responsible — hyperscalers lead, but many lag
- Transparency in grid cost allocation is genuinely lacking
- Regional disparities mean some communities bear more burden than others
8.2 What the "Data Centers Are Good" Narrative Gets Right
- Big Tech renewable investment is genuinely transformative — $57B+ and growing
- Load factor economics favor data centers as grid customers
- Efficiency improvements are real and ongoing
- Economic value creation (jobs, GDP, digital economy) is substantial
- Grid modernization benefits all users, not just data centers
8.3 The Policy Implications
Rather than "data centers vs. citizens," the policy conversation should focus on:
- Transparent cost allocation: Show exactly how infrastructure costs are distributed
- Renewable requirements: Mandate 100% renewable matching for new facilities
- Efficiency standards: Require PUE reporting and minimum standards
- Grid services participation: Incentivize data centers to provide demand response
- Local benefit sharing: Ensure host communities receive tangible economic benefits
9. Conclusion: The Grid's Future is Being Built Now
The uncomfortable truth is this: AI data centers are simultaneously the largest consumers of electricity AND the largest private investors in clean energy infrastructure.
They're not angels — they're profit-driven companies making calculated investments. But those investments are:
- Funding renewable energy projects that might not exist otherwise
- Triggering grid modernization that benefits everyone
- Driving efficiency improvements that reduce the carbon intensity of computing
- Creating economic value that extends far beyond their electricity consumption
The "data centers vs. citizens" framing is politically convenient but economically incomplete. The real question isn't whether data centers should exist — they're essential infrastructure for the modern economy. The question is how to ensure:
- Cost allocation is fair and transparent
- All operators meet high sustainability standards
- Host communities share in the benefits
- Grid investments serve long-term public interest
"The same data centers being blamed for grid stress are funding more renewable energy than most governments. The cognitive dissonance is remarkable."
— Energy Analyst, IEA Report Discussion, 2025
Final Thought: Read both this article and Article 11. The truth lives in the tension between these perspectives. Demand transparency, support renewable requirements, and resist the temptation of simple narratives about complex systems.
All content on ResistanceZero is independent personal research derived from publicly available sources. This site does not represent any current or former employer. Terms & Disclaimer
References & Data Sources
- Amazon Renewable Energy Portfolio Amazon Sustainability — 34 GW renewable capacity as of 2024
- Microsoft Sustainability Report Microsoft — 23.2 GW cumulative renewable commitments, Brookfield deal
- Google Environmental Reports Google — 24/7 Carbon-Free Energy initiative, Kairos nuclear deal
- BloombergNEF Corporate PPA Database BNEF — 50+ GW corporate PPA volume 2024
- Constellation/Microsoft Three Mile Island Restart Constellation Energy — 835 MW nuclear restart, 20-year Microsoft PPA
- Energy+Environmental Economics (E3) Virginia Study E3 — $33,500/MW annual surplus value from data centers
- IEA Energy and AI Report 2025 IEA — Global data center efficiency trends, demand response potential
- Goldman Sachs AI Economic Impact Goldman Sachs — AI capex contributing 1.1% to GDP growth
- Google e-Conomy SEA Report Google/Temasek/Bain — $300B+ SEA digital economy projection
- Uptime Institute Global Data Center Survey Uptime Institute — PUE trends, efficiency benchmarks
- DeepMind AI Cooling Optimization DeepMind — 40% cooling energy reduction through AI
- NREL Cloud Computing Energy Study Lawrence Berkeley National Lab / NREL — 72-93% efficiency improvement cloud vs on-premise