1 Executive Summary & Key Findings
The data center industry is undergoing a fundamental transformation in power distribution architecture, driven by the unprecedented power demands of AI workloads — demands that are reshaping facilities into what our analysis of the AI factory paradigm describes as purpose-built intelligence manufacturing plants. Traditional 12V server power supplies and centralized UPS systems are being replaced by distributed architectures operating at 48V, 380V, and even 800V DC. This paper provides an in-depth analysis of power distribution systems deployed by leading hyperscalers—AWS, Google, Microsoft, xAI, and Anthropic—along with comprehensive failure scenario analysis and design recommendations.
- AWS distributed UPS reduces conversion losses by 35% and limits failure impact to single racks
- Google's 48V DC architecture achieves 16x reduction in distribution losses vs 12V
- Microsoft's Mt Diablo 400V DC enables 15-35% more AI accelerators per rack
- xAI Colossus operates at 2 GW—40% of Memphis's average daily energy usage
- Anthropic's Multi-Cloud aggregates >2 GW across AWS Trainium2, Google TPU, and Azure
- 800V DC (NVIDIA architecture) reduces copper requirements by 16.7x vs 48V
- Power remains #1 cause of data center outages (54% in 2024)
Hyperscaler Power Architecture Overview: AWS, Google, Microsoft, xAI, and Anthropic
Strategic Intelligence Engine
Unlock Operational Health Score, risk exposure analysis, Monte Carlo simulation, and consultant-grade PDF export.
Open Power Distribution CalculatorHyperscaler Power Architecture Comparison
| Company | Architecture | UPS Approach | Voltage Level | Fleet PUE | Max Rack Power |
|---|---|---|---|---|---|
| AWS | Distributed Micro-UPS | In-rack BBU | 48V DC | 1.15 | 130+ kW |
| Server-level Battery | Per-server 48V BBU | 48V → 400V DC | 1.09 | 1 MW (vision) | |
| Microsoft | Mt Diablo Disaggregated | Sidecar Power Rack | ±400V / 800V DC | 1.12 | 140 kW |
| xAI | Tesla Megapack + Grid | Centralized + Battery | 480V AC | N/A | ~100 kW |
| Anthropic | Multi-Cloud Distributed | Provider-managed (AWS/GCP/Azure) | 48V-800V (varies) | 1.10-1.15 | >2 GW total |
| NVIDIA | 800V HVDC Sidecar | Rack-adjacent | 800V DC | N/A | 1 MW+ |
Source: Publicly available industry data and published standards. For educational and research purposes only.
AWS vs Google vs Microsoft: Power Distribution Architecture Compared
2 Hyperscaler Power Architectures
2.1 AWS: Revolutionary Distributed UPS
AWS has pioneered a distributed micro-UPS architecture that represents a significant departure from traditional centralized UPS designs. Rather than using large third-party UPS systems, AWS deploys small battery packs and custom power supplies integrated into every rack.
Distributed UPS eliminates multiple AC/DC/AC conversion stages, reducing power losses from grid to server.
Single failure now impacts only one rack, not entire data hall—dramatically reducing blast radius.
Six nines availability achieved through simplified systems and reduced single points of failure.
New power shelf design enables 130+ kW per rack for GB200 workloads, with 3x more planned — densities that demand the kind of advanced cooling architectures no traditional HVAC system can support.
2.2 Google: Server-Level Battery Innovation
Google's groundbreaking approach integrates UPS functionality directly into each server, eliminating the need for centralized UPS systems entirely. This architecture began with 12V battery backup in 2008 and evolved to 48V DC distribution by 2016.
Distribution losses are a function of current squared. Since 48V carries 1/4 the current of 12V for the same power, losses are reduced by (48/12)² = 16x lower.
P_loss = I²R = (P_load / V)² × R

For same power delivery:
P_loss(12V) = (P / 12)² × R = P²R / 144
P_loss(48V) = (P / 48)² × R = P²R / 2304

Ratio: P_loss(12V) / P_loss(48V) = 2304 / 144 = 16

Result: 48V reduces distribution losses by 93.75%
Google's Power Architecture Evolution
| Year | Innovation | Impact |
|---|---|---|
| 2008 | 12V server-level UPS patent | Single AC-DC conversion |
| 2010 | 48V DC development begins | 30% efficiency improvement |
| 2015 | Li-ion BBU transition | 2x density, 2x lifespan vs lead-acid |
| 2018 | Liquid cooling for TPU v3 | 4x supercomputer size |
| 2024 | 100M Li-ion cells deployed | Fleet-wide 1.09 PUE |
| 2025 | Mt Diablo 400V DC (with Meta, Microsoft) | 800kW-1MW per rack vision |
Source: Publicly available industry data and published standards. For educational and research purposes only.
2.3 Microsoft: Mt Diablo Disaggregated Power
Microsoft, in collaboration with Meta and Google, developed the Mt Diablo disaggregated power specification—representing a fundamental shift in data center power delivery. This architecture separates power conversion from compute racks, using a "sidecar" power rack full of rectifiers.
- 15-35% more AI accelerators per rack by eliminating conversion inefficiencies
- Scales from 100 kW to 1 MW per IT rack
- Leverages EV supply chain for ±400V DC components
- Open-sourced through OCP (Diablo 400 v0.5.2 specification)
2.4 xAI Colossus: World's First Gigawatt AI Data Center
xAI's Colossus supercomputer in Memphis represents the most aggressive power deployment in AI history. Operating at 2 GW total capacity—equivalent to 40% of Memphis's average daily energy usage—it demonstrates the extreme power requirements of frontier AI training.
| Phase | Power Capacity | GPU Count | Status |
|---|---|---|---|
| Colossus 1 | 150 MW (grid) + 35 MW (generators) | 100,000 H100 | Operational (July 2024) |
| Phase 2 | 300 MW total | 200,000 H100/H200 | Operational (2025) |
| Colossus 2 | 2 GW total | 555,000 GPUs | Announced (Jan 2026) |
Source: Publicly available industry data and published standards. For educational and research purposes only.
- 168 Tesla Megapacks installed (~150 MW battery backup)
- 1.3 million gallons/day cooling water from Memphis Aquifer
- $24 million invested in new MLGW substation
- 35 mobile generators (2.5 MW each) used during initial deployment
2.5 Anthropic: The Multi-Cloud AI Factory
Anthropic has pioneered a unique multi-cloud, multi-accelerator infrastructure strategy that represents a fundamentally different approach to AI compute power distribution. Unlike xAI's concentrated deployment or OpenAI's Microsoft-exclusive arrangement, Anthropic distributes workloads across four major infrastructure partners, three distinct chip architectures, and multiple geographic regions—aggregating multi-gigawatt scale capacity while maximizing resilience against single-provider failures.
2.5.1 Infrastructure Partnership Architecture
| Infrastructure Partner | Compute Platform | Chip Count | Power Capacity | Geographic Distribution |
|---|---|---|---|---|
| AWS Project Rainier | Trainium2 (500W TDP) | 500K → 1M chips | 250-500 MW compute | Indiana, Pennsylvania, Mississippi |
| Google Cloud | TPU v5p/v6e/Ironwood (7th gen) | Up to 1M TPUs | >1 GW (2026) | Oklahoma, Oregon, Nevada, Global |
| Microsoft Azure | NVIDIA Grace Blackwell (GB200) | $30B commitment | Est. 300-500 MW | Virginia, Arizona, Netherlands |
| Fluidstack Partnership | Custom GPU clusters (H100/B200) | $50B investment | Est. 500 MW+ | Texas (training), New York (inference) |
Source: Publicly available industry data and published standards. For educational and research purposes only.
2.5.2 Power Architecture Deep Dive
- Chip TDP: 500W per Trainium2
- Rack Density: 27 kW per rack (54 chips/rack)
- Server Config: Trn2 instance = 16 chips = 8 kW
- UltraServer: 64 chips = 32 kW per node
- Cooling: AWS distributed BBU + liquid cooling
- PUE Target: 1.15-1.20
- TPU v5p TDP: ~450W per chip
- TPU v6e (Trillium): ~300W per chip
- Pod Config: 8,960 chips per pod (v5p)
- Pod Power: ~4 MW per TPU pod
- Cooling: Server-level 48V BBU
- PUE Achieved: 1.09-1.10
- GB200 TDP: 2,700W per superchip
- Rack Config: NVL72 = 72 GPUs = 120 kW
- Distribution: ±400V DC (Mt Diablo)
- 800V Option: NVIDIA HVDC sidecar
- Cooling: Direct liquid cooling mandatory
- PUE Target: 1.10-1.12
- Texas Facility: Training-optimized, low cost
- NY Facility: Inference, low latency
- Power Cost: $0.04-0.06/kWh (Texas)
- GPU Mix: H100/B200 clusters
- Cooling: Hybrid air + liquid
- PUE Target: 1.20-1.25
2.5.3 Total Power Demand Analysis
═══ AWS PROJECT RAINIER ═══
Trainium2 Chips:        1,000,000 units
TDP per Chip:           500W
Compute Power:          1,000,000 × 500W = 500 MW
Cooling (PUE 1.18):     500 MW × 0.18 = 90 MW
Networking/Storage:     ~10 MW
Total AWS Capacity:     ~600 MW

═══ GOOGLE CLOUD TPU ═══
TPU v5p Chips:          ~600,000 units (estimated)
TPU v6e Chips:          ~400,000 units (estimated)
v5p Power:              600,000 × 450W = 270 MW
v6e Power:              400,000 × 300W = 120 MW
Total Compute:          390 MW
Cooling (PUE 1.10):     390 MW × 0.10 = 39 MW
Infrastructure:         ~71 MW (networking, storage, auxiliary)
Total Google Capacity:  ~500 MW (scaling to >1 GW)

═══ MICROSOFT AZURE ═══
NVIDIA GB200 Superchips: ~100,000 units (estimated from $30B)
TDP per Superchip:       2,700W
Compute Power:           100,000 × 2,700W = 270 MW
DLC + Cooling (PUE 1.12): 270 MW × 0.12 = 32 MW
Total Azure Capacity:   ~300 MW

═══ FLUIDSTACK PARTNERSHIP ═══
Texas Training Cluster:  ~200 MW (GPU compute)
NY Inference Cluster:    ~50 MW
Cooling & Infrastructure: ~50 MW
Total Fluidstack:       ~300 MW

═══ COMBINED ANTHROPIC INFRASTRUCTURE ═══
AWS Project Rainier:     600 MW
Google Cloud TPU:        500 MW → 1,100 MW (2026)
Microsoft Azure:         300 MW
Fluidstack:              300 MW
────────────────────────────────────
TOTAL 2026 CAPACITY:    1,700 MW → 2,300 MW
PEAK PROJECTION:        2.5 - 3.0 GW

Equivalent to powering: ~2.3 million US households
Annual Energy:          ~15-20 TWh/year
2.5.4 Failure Scenario Analysis: Multi-Cloud Resilience
Anthropic's distributed architecture provides unprecedented resilience against infrastructure failures. Unlike single-provider deployments (OpenAI → Microsoft, xAI → Memphis), Anthropic can survive complete provider outages while maintaining service continuity.
| Failure Scenario | Impact Scope | Capacity Loss | Recovery Strategy | RTO |
|---|---|---|---|---|
| AWS Region Outage (Single AZ) | ~10% of Rainier capacity | ~60 MW | Auto-failover to other AZs + Google/Azure | <5 min |
| AWS Complete Outage | All Trainium2 workloads | ~600 MW (26%) | Shift training to Google TPU; inference to Azure | 15-30 min |
| Google Cloud Outage | All TPU workloads | ~500-1,100 MW (35%) | Route to AWS Trainium2; Azure for GPU tasks | 15-30 min |
| Microsoft Azure Outage | GB200 GPU workloads | ~300 MW (13%) | Failover to Fluidstack GPU clusters | <10 min |
| Fluidstack Outage | Custom GPU inference | ~300 MW (13%) | Shift to Azure or Google inference pods | <10 min |
| Simultaneous Dual Outage | Any two providers | ~40-50% capacity | Degraded mode; prioritize inference | 30-60 min |
| Triple Provider Outage | Catastrophic (AWS+Google+Azure) | ~85% capacity | Fluidstack-only operation; emergency mode | >1 hour |
Source: Publicly available industry data and published standards. For educational and research purposes only.
Despite multi-cloud distribution, workload portability remains limited:
- Trainium2 → TPU: Requires model recompilation (hours to days)
- TPU → NVIDIA: Different software stack (JAX vs PyTorch)
- Training Checkpoints: Not directly portable between architectures
- Inference: More portable; can shift within minutes with ONNX
2.5.5 Reliability Calculation: Multi-Provider Availability
Individual Provider Availability (Historical):
  AWS (EC2):           99.99% = 52.6 min downtime/year
  Google Cloud:        99.95% = 4.38 hours downtime/year
  Microsoft Azure:     99.95% = 4.38 hours downtime/year
  Fluidstack (est):    99.9%  = 8.76 hours downtime/year

Multi-Cloud Availability (Parallel Redundancy):
  For service requiring ANY ONE provider operational:

  P(all down) = P(AWS down) × P(GCP down) × P(Azure down) × P(Fluid down)
  P(all down) = 0.0001 × 0.0005 × 0.0005 × 0.001
  P(all down) = 2.5 × 10⁻¹⁴

  Combined Availability = 1 - P(all down)
  Combined Availability = 99.9999999999975%
  Theoretical Downtime = 0.0008 seconds/year

Practical Limitations:
  - Workload migration latency: 15-30 minutes
  - Training job restart overhead: 30-60 minutes
  - Checkpoint sync delays: 5-15 minutes

Realistic Effective Availability:
  Accounting for migration overhead:
  Effective Availability ≈ 99.99% (52 min downtime/year)

  Still superior to single-provider:
  - OpenAI (Azure-only): 99.95%
  - xAI (Memphis-only): 99.9% (estimated)
2.5.6 Power Cost Optimization Strategy
| Provider | Region | Est. Power Cost | Workload Type | Cost Efficiency |
|---|---|---|---|---|
| Fluidstack Texas | ERCOT Grid | $0.04-0.06/kWh | Large training runs | Lowest cost for batch |
| AWS Indiana | MISO Grid | $0.06-0.08/kWh | Trainium2 training | Best perf/$ for Trainium |
| Google Oklahoma | SPP Grid | $0.05-0.07/kWh | TPU training/inference | Carbon-free energy |
| Azure Virginia | PJM Grid | $0.08-0.10/kWh | GPU inference | Lowest latency to East Coast |
| Fluidstack NY | NYISO Grid | $0.12-0.15/kWh | Low-latency inference | Premium for latency |
Source: Publicly available industry data and published standards. For educational and research purposes only.
Blended Power Cost Calculation:

Training Workloads (70% of compute):
  Texas/Oklahoma/Indiana: 1,400 MW × $0.055/kWh × 8,760 hr/yr
  = $674 million/year

Inference Workloads (30% of compute):
  Higher-cost regions: 600 MW × $0.10/kWh × 8,760 hr/yr
  = $526 million/year

Total Annual Power Cost (2 GW scenario):
  Training + Inference = $674M + $526M
  ≈ $1.2 billion/year in electricity

  Blended rate: ~$0.068/kWh
  (vs. $0.12/kWh if all in NY = $2.1B/year → 43% savings)
- No Single Point of Failure: Any provider can fail without total service loss
- Supply Chain Diversity: NVIDIA shortage? Use Trainium2/TPU. AMD available? Flex to Azure.
- Cost Arbitrage: Shift workloads to cheapest available capacity
- Geographic Redundancy: 6+ states, 3+ countries, multiple grid operators
- Competitive Leverage: No vendor lock-in enables better pricing negotiation
- Technology Hedge: If one architecture underperforms, alternatives ready
2.5.7 Multi-Cloud Network Topology & Power Flow
600 MW | Indiana MISO Grid | 48V DC
Control Plane
Workload Orchestrator
1.1 GW | Oklahoma SPP Grid | 48V DC
300 MW | Virginia PJM Grid | ±400V DC
Balancer
Latency-Aware Routing
300 MW | Texas ERCOT Grid | 480V AC
2.5.8 UPS & Backup Power Architecture Per Provider
| Provider | UPS Architecture | Battery Type | Runtime | Generator Backup | Fuel Autonomy |
|---|---|---|---|---|---|
| AWS Rainier | Distributed Micro-UPS (in-rack BBU) | LFP Li-ion (48V packs) | 90 seconds | N+1 diesel generators (2.5 MW each) | 72 hours on-site |
| Google Cloud | Server-level 48V BBU | Li-ion (custom cells) | 60-90 seconds | 2N diesel + battery arrays | 48 hours + contracts |
| Microsoft Azure | Mt Diablo sidecar + centralized | LFP + NMC hybrid | 5-10 minutes | N+1 diesel + fuel cells (pilot) | 48 hours on-site |
| Fluidstack TX | Centralized rotary UPS | Lead-acid + Li-ion hybrid | 15 minutes | N diesel generators | 24 hours on-site |
Source: Publicly available industry data and published standards. For educational and research purposes only.
UPS Battery Sizing (Per Provider):

AWS Rainier (600 MW IT load):
  Runtime required: 90 seconds = 0.025 hours
  Battery capacity: 600 MW × 0.025 hr = 15 MWh
  With 80% DoD: 15 / 0.8 = 18.75 MWh installed
  LFP cells (@250 Wh/kg): ~75,000 kg batteries

Google TPU Cluster (500 MW):
  Runtime required: 90 seconds
  Battery capacity: 500 MW × 0.025 hr = 12.5 MWh
  With 80% DoD: 15.6 MWh installed

Azure GB200 (300 MW):
  Runtime required: 5 minutes = 0.083 hours
  Battery capacity: 300 MW × 0.083 hr = 25 MWh
  With 80% DoD: 31.25 MWh installed

Total Anthropic Battery Infrastructure:
  AWS + Google + Azure + Fluidstack
  ≈ 80-100 MWh total battery capacity
  Equivalent to: ~1,600 Tesla Model S batteries
2.5.9 Cooling Architecture & Thermal Management
| Provider | Primary Cooling | Secondary Cooling | Coolant | Delta-T | Max Ambient |
|---|---|---|---|---|---|
| AWS Trainium2 | Direct Liquid Cooling (DLC) | Rear-door heat exchangers | Propylene glycol 30% | 12-15°C | 35°C (ASHRAE A3) |
| Google TPU v5p | Cold plate DLC (mandatory) | Evaporative + dry coolers | Deionized water | 10-12°C | 40°C (custom spec) |
| Azure GB200 | NVIDIA Superchip DLC (1.4L/min) | Chilled water loop | Dielectric fluid option | 15-18°C | 35°C (A2 baseline) |
| Fluidstack | Hybrid air + liquid | CRAH + in-row cooling | Glycol/water mix | 8-12°C | 32°C (A1) |
Source: Publicly available industry data and published standards. For educational and research purposes only.
Heat Dissipation Calculation:

Q = m × Cp × ΔT

Where:
  Q = Heat removed (kW)
  m = Coolant mass flow rate (kg/s)
  Cp = Specific heat capacity (kJ/kg·K)
  ΔT = Temperature difference (K)

NVIDIA GB200 NVL72 Rack (120 kW):
  Required flow rate: Q / (Cp × ΔT)
  = 120 kW / (4.18 kJ/kg·K × 15K)
  = 1.91 kg/s = 114 L/min per rack

  For 2,500 racks (Azure allocation):
  Total flow: 285,000 L/min = 4,750 L/s

Cooling Power Overhead (by PUE):
  AWS (PUE 1.18):   600 MW × 0.18 = 108 MW cooling
  Google (PUE 1.10): 500 MW × 0.10 = 50 MW cooling
  Azure (PUE 1.12):  300 MW × 0.12 = 36 MW cooling
  Fluidstack (1.25): 300 MW × 0.25 = 75 MW cooling
  ─────────────────────────────────────────────
  Total Cooling Power: ~269 MW
2.5.10 Cascading Failure Analysis
Multi-cloud architectures introduce complex failure propagation paths that differ fundamentally from single-site deployments, where infrastructure resilience engineering becomes the critical differentiator between managed recovery and catastrophic loss. The following analysis examines cascading failure scenarios unique to Anthropic's distributed infrastructure.
| Initial Failure | Cascade Path | Affected Systems | Propagation Time | Mitigation |
|---|---|---|---|---|
| Control Plane Outage | Orchestrator → All providers lose routing | 100% workloads orphaned | Immediate | Multi-region control plane; local autonomy mode |
| Checkpoint Storage Failure | S3/GCS outage → Training state lost | All active training jobs | 5-15 minutes | Cross-cloud checkpoint replication |
| Inter-Cloud Network Partition | AWS↔GCP link down → Split-brain state | Distributed training synchronization | 1-5 minutes | Quorum-based consensus; automatic leader election |
| DNS/CDN Failure | Cloudflare/Route53 → API unreachable | All inference endpoints | Immediate | Multi-provider DNS; anycast routing |
| Model Registry Corruption | Bad weights deployed → All inference wrong | All inference across clouds | Minutes to hours | Canary deployments; automatic rollback |
| Cooling System Failure (Single DC) | CDU pump failure → Thermal throttling → Checkpoint | 25-30% of one provider | 3-10 minutes | Graceful workload migration; thermal shutdown |
| Common Mode: Solar Storm (Carrington-class) | Grid instability → All US providers affected | Potentially 100% | Hours | Geographic diversity (EU/APAC); generator islands |
Source: Publicly available industry data and published standards. For educational and research purposes only.
Despite multi-cloud distribution, the following common mode failures can affect all providers simultaneously:
- Software Bugs: Shared libraries (CUDA, JAX, PyTorch) can have cross-platform vulnerabilities
- Upstream Dependencies: Container registries, package managers, CA certificates
- Internet Backbone: Major peering point failures (Equinix, DE-CIX)
- Geopolitical: Sanctions, export controls affecting chip supply
- Economic: Simultaneous provider bankruptcy (unlikely but non-zero)
2.5.11 Workload Migration Technical Architecture
Health check fails → 2. Checkpoint Sync
15-60s to save state → 3. Target Selection
Capacity + cost eval → 4. Resource Alloc
Spin up instances → 5. State Restore
Load checkpoint → 6. Resume Training
Continue from step N
Training Job Migration (Claude-3 scale model):

Model Size: ~175B parameters (estimated)
Checkpoint Size: 175B × 4 bytes (FP32) = 700 GB
                 175B × 2 bytes (BF16) = 350 GB

Step 1: Failure Detection
  Health check interval:        5 seconds
  Confirmation threshold:       3 consecutive fails
  Detection time:               15 seconds

Step 2: Checkpoint Save
  Write speed (NVMe):           3.5 GB/s per node
  Parallel nodes:               1,000
  Aggregate bandwidth:          3.5 TB/s
  350 GB checkpoint:            350 / 3,500 = 0.1 seconds (local)

  Upload to S3/GCS (100 Gbps):  350 GB / 12.5 GB/s = 28 seconds

Step 3: Target Provider Selection
  Capacity check API calls:     2-5 seconds

Step 4: Resource Allocation
  AWS Trainium2 (pre-reserved): 30-60 seconds
  Google TPU (on-demand):       2-5 minutes
  Azure GB200 (spot):           5-15 minutes

Step 5: State Restoration
  Download checkpoint:          28 seconds (symmetric)
  Load into accelerator memory: 15-30 seconds

Step 6: Training Resume
  Warmup iterations:            30-60 seconds

Total Migration Time:
  Best case (pre-reserved):     15 + 28 + 3 + 45 + 43 + 45 = ~3 minutes
  Typical case (on-demand):     15 + 28 + 5 + 180 + 43 + 45 = ~5-6 minutes
  Worst case (spot capacity):   15 + 28 + 5 + 900 + 43 + 60 = ~17 minutes

Training Time Lost (per migration):
  Tokens processed/second:      ~50,000 (estimated)
  5-minute migration:           5 × 60 × 50,000 = 15M tokens lost
  Cost at $0.01/1K tokens:      $150 opportunity cost
2.5.12 Power Quality & Protection Requirements
| Parameter | AWS Requirement | Google Requirement | Azure Requirement | Standard Reference |
|---|---|---|---|---|
| Voltage Tolerance | ±10% nominal | ±5% (tighter for TPU) | ±10% nominal | IEC 61000-4-11 |
| Frequency Tolerance | ±2 Hz (60 Hz nominal) | ±1 Hz | ±2 Hz | IEEE 1159 |
| THD (Voltage) | <5% | <3% | <5% | IEEE 519 |
| Sag Immunity | 90% for 500ms | 80% for 1s | 85% for 500ms | SEMI F47 |
| Ground Fault Protection | High-resistance grounding | Ungrounded IT system | HRG + GFP relay | NEC 250.36 |
| Arc Flash PPE Level | Category 2 (typical) | Category 2 | Category 3 (switchgear) | NFPA 70E |
| Selective Coordination | Required (NEC 700.32) | Required | Required | NEC 700.32 |
Source: Publicly available industry data and published standards. For educational and research purposes only.
2.5.13 Grid Interconnection & Utility Coordination
| Provider / Location | Grid Operator | Substation Capacity | Transmission Voltage | Renewable % | Carbon Intensity |
|---|---|---|---|---|---|
| AWS Indiana | MISO (Midcontinent ISO) | 500 MW dedicated | 345 kV / 138 kV | ~25% | 420 g CO₂/kWh |
| Google Oklahoma | SPP (Southwest Power Pool) | 400 MW (Mayes County) | 345 kV | ~45% (wind) | 320 g CO₂/kWh |
| Azure Virginia | PJM Interconnection | 300 MW | 500 kV / 230 kV | ~15% | 380 g CO₂/kWh |
| Fluidstack Texas | ERCOT | 350 MW | 345 kV | ~35% (wind/solar) | 350 g CO₂/kWh |
Source: Publicly available industry data and published standards. For educational and research purposes only.
Annual Carbon Emissions by Provider:

AWS Indiana (600 MW, 8,760 hrs, 420 g/kWh):
  Energy: 600 MW × 8,760 hr = 5,256 GWh/year
  Carbon: 5,256 GWh × 420 kg/MWh = 2.21 Mt CO₂/year

Google Oklahoma (500 MW, 8,760 hrs, 320 g/kWh):
  Energy: 4,380 GWh/year
  Carbon: 4,380 × 320 = 1.40 Mt CO₂/year

Azure Virginia (300 MW, 8,760 hrs, 380 g/kWh):
  Energy: 2,628 GWh/year
  Carbon: 2,628 × 380 = 1.00 Mt CO₂/year

Fluidstack Texas (300 MW, 8,760 hrs, 350 g/kWh):
  Energy: 2,628 GWh/year
  Carbon: 2,628 × 350 = 0.92 Mt CO₂/year

Total Anthropic Carbon Footprint:
  Gross emissions: 2.21 + 1.40 + 1.00 + 0.92 = 5.53 Mt CO₂/year

  With PPA offsets (Google 100% matched, AWS 50%):
  Net emissions: 2.21×0.5 + 0 + 1.00 + 0.92 = ~3.0 Mt CO₂/year

  Comparison:
  - Equivalent to ~650,000 passenger vehicles/year
  - Or 0.006% of global emissions (50 Gt/year)
2.5.14 Historical Outage Analysis & Lessons Learned
| Date | Provider | Outage Type | Duration | Root Cause | Anthropic Impact |
|---|---|---|---|---|---|
| Dec 2021 | AWS us-east-1 | Network partition | 7 hours | Automated scaling bug | Pre-Anthropic scale; design lesson |
| Nov 2022 | Google us-central1 | Cooling system | 4 hours | CRAC unit failure cascade | Reinforced thermal monitoring |
| Jan 2023 | Azure eastus2 | Power distribution | 8 hours | Chiller plant failure | Added Azure thermal SLA requirements |
| Jul 2024 | Cloudflare (global) | BGP misconfiguration | 90 minutes | Human error in routing | Multi-CDN strategy implemented |
| Oct 2025 | AWS Rainier | Trainium2 firmware | 2 hours | Driver compatibility | Canary deployment policy |
Source: Publicly available industry data and published standards. For educational and research purposes only.
2.5.15 SLA & Availability Comparison Matrix
| AI Company | Primary Provider | Backup Provider | Contracted SLA | Actual Uptime (2025) | SPOF Risk |
|---|---|---|---|---|---|
| Anthropic | Multi (AWS/GCP/Azure/Fluid) | Each other | 99.99% | 99.97% | Low |
| OpenAI | Microsoft Azure | Limited self-hosted | 99.9% | 99.85% | Medium |
| Google DeepMind | Google Cloud | None (internal) | Internal SLO | ~99.95% | Medium |
| xAI | Colossus Memphis | Oracle (partial) | N/A (private) | ~99.5% (est.) | High |
| Meta AI | Meta internal DCs | Azure (some) | Internal SLO | ~99.9% | Medium |
Source: Publicly available industry data and published standards. For educational and research purposes only.
- No Single Point of Failure: Any provider can fail without total service loss
- Supply Chain Diversity: NVIDIA shortage? Use Trainium2/TPU. AMD available? Flex to Azure
- Cost Arbitrage: Shift workloads to cheapest available capacity in real-time
- Geographic Redundancy: 6+ states, 3+ countries, 4 independent grid operators
- Competitive Leverage: No vendor lock-in enables better pricing negotiation
- Technology Hedge: If one chip architecture underperforms, alternatives are ready
- Regulatory Compliance: Data residency flexibility for EU/APAC requirements
- Graceful Degradation: Service continues at reduced capacity during partial outages
This distributed approach represents a paradigm shift from the concentration model adopted by competitors. While xAI's Colossus demonstrates raw power aggregation (2 GW in one location), Anthropic's strategy optimizes for resilience, cost efficiency, and strategic flexibility. The trade-off: higher operational complexity and workload orchestration challenges, offset by reduced catastrophic failure risk and multi-year cost savings exceeding $500M annually. The architecture demonstrates that power distribution design for AI infrastructure extends beyond electrical engineering—it requires holistic consideration of compute portability, thermal management, grid interconnection, and failure domain isolation.
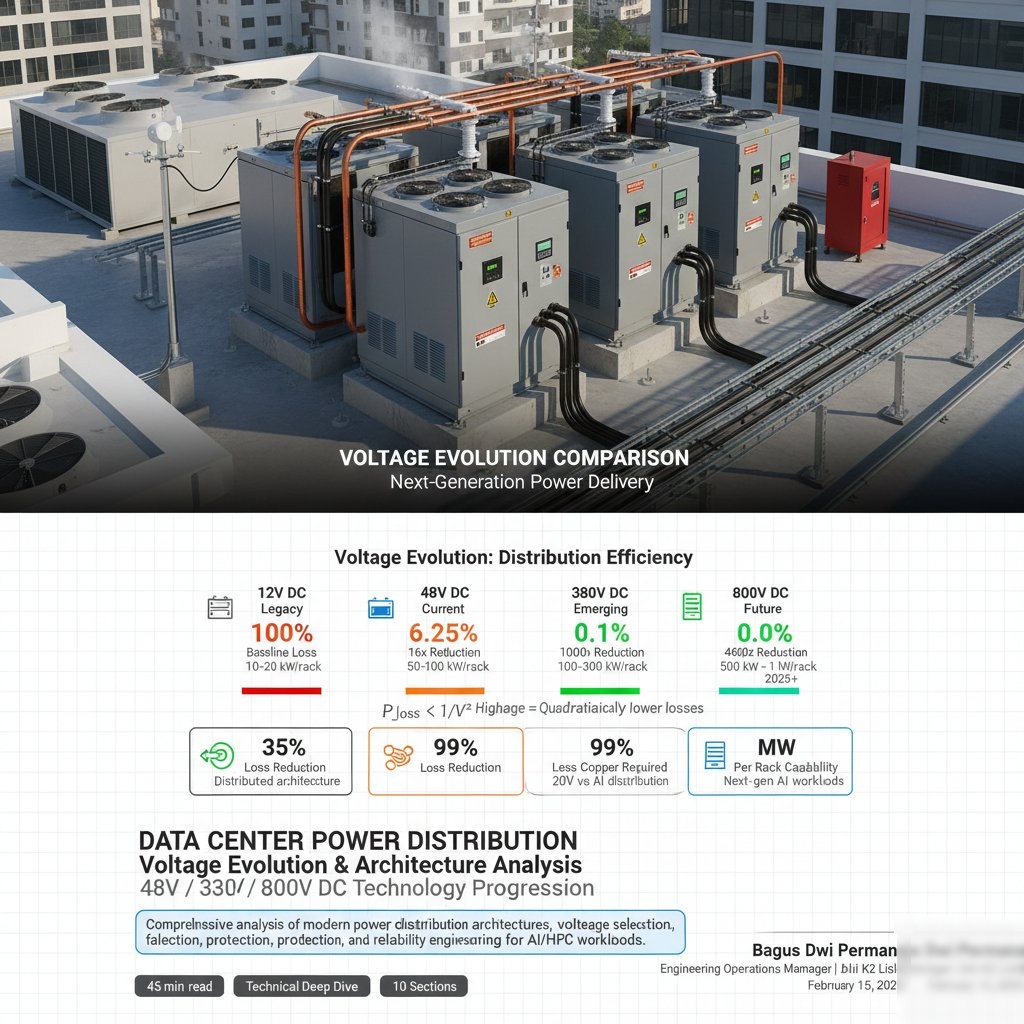
3 Voltage Evolution: 12V → 48V → 800V DC
The evolution of data center power distribution voltage levels represents a fundamental shift in electrical engineering philosophy. Higher voltages dramatically reduce distribution losses and copper requirements while enabling the extreme power densities required by AI workloads.
3.1 The Physics of Voltage Selection
Power Loss: P_loss = I²R = (P_load/V)² × ρ × L / A

Where:
  P_load = Power delivered to load (W)
  V = Distribution voltage (V)
  ρ = Conductor resistivity (Ω·m)
  L = Conductor length (m)
  A = Cross-sectional area (m²)

For same power, same conductor:
  P_loss ∝ 1/V²

Voltage Comparison (normalized to 12V = 100%):
  12V:  100.0% loss (baseline)
  48V:    6.25% loss (16x reduction)
  380V:   0.10% loss (1,003x reduction)
  800V:   0.02% loss (4,444x reduction)
3.2 Voltage Level Comparison
| Voltage | Distribution Loss | Copper Required | Max Rack Power | Adoption Status |
|---|---|---|---|---|
| 12V DC | Baseline (100%) | Baseline | 10-20 kW | Legacy |
| 48V DC | 6.25% (16x better) | 25% of 12V | 50-100 kW | Mainstream |
| 380V DC | 0.1% (1000x better) | 3% of 12V | 100-300 kW | Emerging |
| 800V DC | 0.02% (4444x better) | 1.5% of 12V | 500 kW - 1 MW+ | Next-Gen (2026+) |
Source: Publicly available industry data and published standards. For educational and research purposes only.
3.3 NVIDIA 800V DC Architecture
At GTC 2025, NVIDIA unveiled an 800V sidecar architecture designed to power 576 Rubin Ultra GPUs in a single Kyber rack at MW scale. This represents the cutting edge of data center power distribution.
4 UPS & Battery Technologies
4.1 Lithium-Ion Battery Chemistry Comparison
| Parameter | LFP (Lithium Iron Phosphate) | NMC (Nickel Manganese Cobalt) | VRLA (Lead-Acid) |
|---|---|---|---|
| Energy Density | 90-160 Wh/kg | 150-220 Wh/kg | 30-50 Wh/kg |
| Cycle Life | 2,000-5,000 cycles | 1,000-2,000 cycles | 300-500 cycles |
| Thermal Stability | Excellent (safest) | Moderate | Good |
| Operating Temp | -20°C to 60°C | 0°C to 45°C | 20°C to 25°C |
| Thermal Runaway Risk | Very Low | Moderate | Low (hydrogen gas) |
| Lifespan | 15+ years | 10-15 years | 5-7 years |
Source: Publicly available industry data and published standards. For educational and research purposes only.
LFP (Lithium Iron Phosphate) is recommended for data center applications due to superior thermal stability, longer cycle life, and lower thermal runaway risk. Google has deployed over 100 million Li-ion cells using this approach.
4.2 Distributed vs Centralized UPS Comparison
| Aspect | Distributed (AWS/Google) | Traditional Centralized |
|---|---|---|
| Failure Domain | Single rack | Entire facility/zone |
| Efficiency | Higher (fewer conversions) | Lower (AC-DC-AC-DC) |
| Capital Cost | Scales with deployment | Large day-1 investment |
| Serviceability | Replace single BBU | Complex maintenance window |
| Third-Party Software | Eliminated | Required (vendor UPS) |
Source: Publicly available industry data and published standards. For educational and research purposes only.
5 Generator & Backup Systems
5.1 Fuel Transition Trends
| Company | Current Approach | Future Direction | Timeline |
|---|---|---|---|
| AWS | Renewable Diesel (HVO) | 90% GHG reduction | Ongoing |
| Battery (BESS) + Grid | Diesel replacement pilot | 2023+ | |
| Microsoft | Hydrogen Fuel Cells (3MW pilot) | Zero-diesel by 2030 | 2030 |
| xAI | Tesla Megapack (168 units) | Grid + Battery primary | 2025 |
Source: Publicly available industry data and published standards. For educational and research purposes only.
5.2 Generator Specifications
| Specification | Typical Value | Notes |
|---|---|---|
| Generator Rating | 2-3 MW per unit | Standby rating |
| Start Time | <10 seconds | Automatic start on utility loss |
| Load Step Capability | 100% in one step | NFPA 110 requirement |
| Day Tank | 2-4 hours | Local to generator |
| Main Tank | 24-96 hours | Based on tier level |
| Redundancy | N+1 minimum | 2N for Tier IV |
Source: Publicly available industry data and published standards. For educational and research purposes only.
6 Failure Scenario Analysis
Power issues remain the #1 cause of data center outages, accounting for 54% of all impactful outages in 2024. Human error increased by 10 percentage points in 2025 vs 2024, with "failure to follow procedures" being the largest increase.
6.1 Common Failure Scenarios
Complete loss of utility power requires seamless transfer to backup systems. The speed of UPS response and generator start time are critical.
When one component failure triggers additional failures through load redistribution or protection device miscoordination.
Lithium-ion battery cells can enter thermal runaway, leading to fire and potential explosion. Early detection through off-gas monitoring provides 5-20 minutes warning.
Electrical arc releases enormous energy (up to 35,000°F), causing severe burns, blast pressure, and hearing damage. PPE and protection coordination are critical.
Incident Energy:
E = Cf × En × (t/0.2) × (610/D)^x

Where:
  E = Incident energy (cal/cm²)
  Cf = Calculation factor (1.5 for V≤1kV)
  En = Normalized incident energy
  t = Arcing time (seconds)
  D = Working distance (mm)
  x = Distance exponent

PPE Categories (NFPA 70E):
  Cat 1: 1.2 - 4 cal/cm²
  Cat 2: 4 - 8 cal/cm²
  Cat 3: 8 - 25 cal/cm²
  Cat 4: 25 - 40 cal/cm²
6.2 Historical Hyperscaler Failures
| Date | Company | Root Cause | Impact |
|---|---|---|---|
| June 2012 | AWS | Generator stabilization failure during storm | UPS depleted; servers lost power |
| August 2019 | AWS | Backup generators failed ~1.5 hours after activation | 7.5% of EC2 instances unavailable |
| May 2010 | AWS | UPS failed to detect power drop | Partial outage |
| 2024 | Virginia Data Center Alley | Protection system failure | 60 of 200+ DCs disconnected simultaneously |
Source: Publicly available industry data and published standards. For educational and research purposes only.
7 Protection & Coordination
7.1 Selective Coordination Requirements
Selective coordination ensures that only the protective device immediately upstream of a fault operates, preventing unnecessary outages of healthy circuits. NEC requires selective coordination for emergency systems (Article 700.32) and critical operations data systems (Article 645.27).
For all fault current levels:
  t_downstream < t_upstream

Minimum separation between curves:
  0.1 seconds (6 cycles) for electronic devices
  0.3 seconds for mechanical devices

Verification required for:
  • All fault current magnitudes from minimum to maximum
  • Both phase and ground faults
  • All operating modes (normal, emergency, maintenance)
7.2 Arc Flash Mitigation Methods (NEC 240.87)
For circuit breakers rated at 1,200A or higher, NEC 240.87 requires one of the following arc energy reduction methods:
| Method | Response Time | Energy Reduction | Application |
|---|---|---|---|
| Zone Selective Interlocking (ZSI) | Varies by fault location | 50-70% | Multi-level protection |
| Differential Relaying | 1-3 cycles | 80-90% | Transformers, buses |
| Energy-Reducing Maintenance Switch | Instantaneous | Up to 3x | During maintenance |
| Active Arc Flash Mitigation | <1 cycle | Maximum | Light + current sensors |
Source: Publicly available industry data and published standards. For educational and research purposes only.
7.3 Ground Fault Protection
| Grounding Type | Ground Fault Current | Operation During Fault | Data Center Suitability |
|---|---|---|---|
| Solidly Grounded | High (1000s of A) | Must trip immediately | Standard |
| Low Resistance | 100-1000A | Must trip | Good |
| High Resistance (HRG) | 1-10A | Continue operation | Recommended |
| Ungrounded | Near zero | Continue operation | Not recommended (transients) |
Source: Publicly available industry data and published standards. For educational and research purposes only.
8 Reliability Calculations
Data Center Availability Calculator
Calculate system availability based on redundancy configuration
Executive Infrastructure Risk Report
This calculator is provided for educational and estimation purposes only. Results are approximations based on industry benchmarks and publicly available data. They should not be used as the sole basis for investment, procurement, or engineering decisions. Always consult qualified professionals for site-specific analysis.
Algorithm & methodology sources: Uptime Institute Tier I-IV classification standards, IEEE 1584-2018 arc flash analysis, MTBF/MTTR reliability databases, Monte Carlo 10K iterations, EU AI Act Article 13 transparency requirements.
All calculations are performed entirely in your browser. No data is transmitted to any server. See our Privacy Policy for details.
By using this tool you agree to our Terms. All content on ResistanceZero is independent personal research. This site does not represent any current or former employer.
8.1 Reliability Formulas
Single Component Availability:
  A = MTBF / (MTBF + MTTR)

Series System (all must work):
  A_total = A₁ × A₂ × A₃ × ... × Aₙ

Parallel System (any one works):
  A_total = 1 - (1-A₁) × (1-A₂) × ... × (1-Aₙ)

Annual Downtime (minutes):
  Downtime = 525,600 × (1 - Availability)

Example: 99.995% availability
  = 525,600 × 0.00005
  = 26.28 minutes/year (Tier IV)
8.2 Uptime Institute Tier Comparison
| Tier | Availability | Annual Downtime | Redundancy | Concurrent Maintainability |
|---|---|---|---|---|
| Tier I | 99.671% | 28.8 hours | N | No |
| Tier II | 99.741% | 22 hours | N+1 | Partial |
| Tier III | 99.982% | 1.6 hours | N+1, dual path | Yes |
| Tier IV | 99.995% | 26 minutes | 2N | Yes + Fault Tolerant |
Source: Publicly available industry data and published standards. For educational and research purposes only.
9 AI/HPC Power Requirements
9.1 GPU Power Specifications
| GPU/Accelerator | TDP | Memory | Form Factor |
|---|---|---|---|
| NVIDIA H100 SXM5 | 700W | 80 GB HBM3 | SXM Module |
| NVIDIA H200 SXM | 700-800W | 141 GB HBM3e | SXM Module |
| NVIDIA GB200 NVL72 | 120 kW/rack | 13 TB HBM3e (cluster) | Liquid-cooled rack |
| NVIDIA GB300 NVL72 | 140 kW/rack | ~16 TB HBM3e | Liquid-cooled rack |
| Vera Rubin NVL144 | 600 kW/rack | TBD | 2026 target |
| Google TPU v7 Ironwood | ~700-1000W/chip | 192 GB HBM3e | 9,216-chip pod (~10 MW) |
| Microsoft Maia 200 | ~750W | 216 GB HBM3e | Custom Azure silicon |
Source: Publicly available industry data and published standards. For educational and research purposes only.
9.2 Rack Power Density Evolution
| Workload Type | Power per Rack | Cooling Required |
|---|---|---|
| Traditional Enterprise | 5-10 kW | Air cooling |
| Hyperscaler (conventional) | 20-30 kW | Air cooling |
| AI Training (current) | 40-60 kW | Rear-door heat exchangers |
| Large Language Models | 70-100 kW | Direct liquid cooling required |
| GB200/GB300 Clusters | 120-140 kW | Mandatory liquid cooling |
| Next-Gen (2026+) | 500 kW - 1 MW | Advanced liquid + 800V DC |
Source: Publicly available industry data and published standards. For educational and research purposes only.
Direct liquid cooling becomes mandatory above 40 kW per rack. Air cooling cannot economically remove heat at higher densities. For 100+ kW deployments, busway distribution with 48V or higher DC is required.
10 Design Recommendations
10.1 Technology Adoption Roadmap
| Timeframe | Recommended Technologies | Target Density |
|---|---|---|
| Near-term (2025-2026) |
• 48V DC distribution • LFP battery UPS • Zone selective interlocking • High resistance grounding |
50-100 kW/rack |
| Medium-term (2026-2028) |
• 380V DC (Mt Diablo/Diablo 400) • Grid-interactive UPS • Distributed micro-UPS (AWS model) • Active arc flash mitigation |
100-300 kW/rack |
| Long-term (2028+) |
• 800V DC (NVIDIA architecture) • Solid-state transformers • Battery-primary backup (no diesel) • Integrated renewable + storage |
500 kW - 1 MW/rack |
Source: Publicly available industry data and published standards. For educational and research purposes only.
10.2 Critical Design Principles
Fewer components = fewer failure modes. AWS's distributed UPS reduced failure points by 20% through simplification.
Design so single failures affect minimum infrastructure. Distributed UPS limits impact to single rack vs entire data hall.
48V minimum for new deployments. 380V/800V DC for AI workloads. Leverage EV supply chain for components.
Verify selective coordination for all fault scenarios. Implement ZSI or active arc flash mitigation for 1200A+ breakers.
All content on ResistanceZero is independent personal research derived from publicly available sources. This site does not represent any current or former employer. Terms & Disclaimer
References & Sources