Table of Contents
1. The Question That's Breaking the Internet
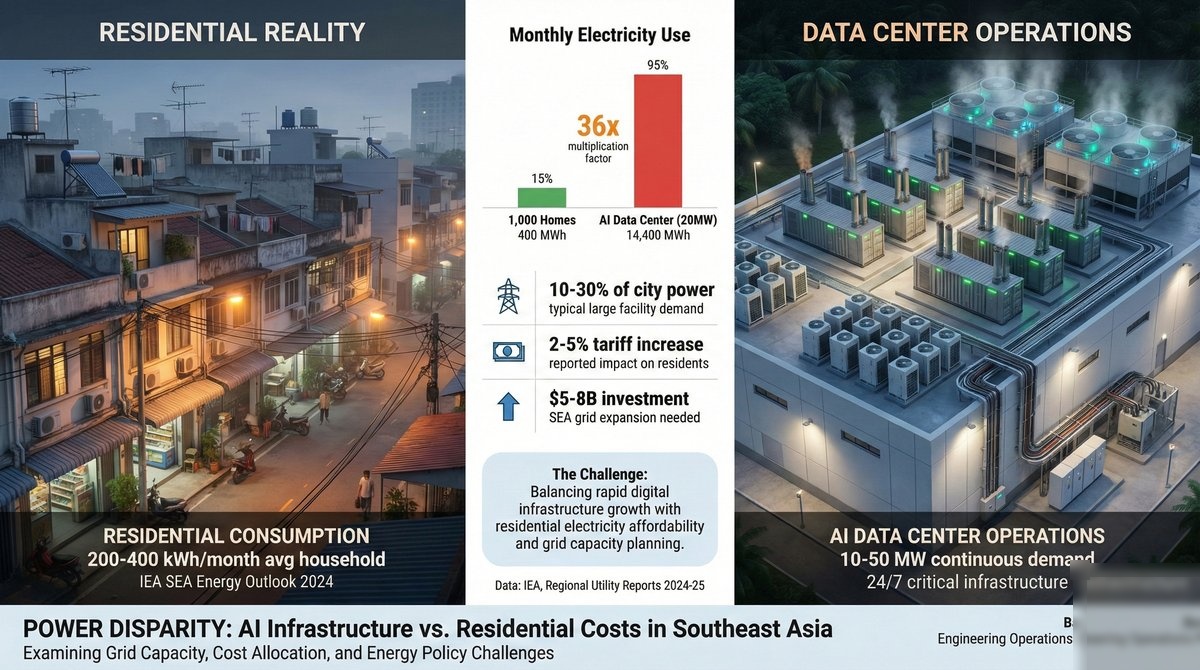
Across Southeast Asia, a controversial question is sparking heated debates on social media: "Why are citizens asked to conserve electricity while AI data centers consume megawatts without restriction?"
The anger is palpable. Posts questioning this apparent double standard regularly exceed thousands of likes and reposts. And the frustration is understandable when you see the numbers.
The Core Controversy
A single AI-focused data center consumes electricity equivalent to 100,000 households.
The largest facilities under construction will use 20x more — equivalent to 2 million homes.
Source: International Energy Agency (IEA), 2025
Data Validity Notice
Data, tariff rates, and projections in this article are based on publicly available sources as of February 2026. Electricity prices fluctuate based on fuel costs, policy changes, and market conditions. Use the interactive calculator for real-time estimates with latest available data.
2. The Numbers Don't Lie: Global Data Center Energy Explosion
According to the International Energy Agency (IEA), data centers consumed approximately 415 terawatt-hours (TWh) of electricity globally in 2024 — representing 1.5% of total global electricity consumption.
But here's what's alarming: this is projected to double to 945 TWh by 2030, growing at 15% annually — four times faster than all other sectors combined.
Global Data Center Electricity Consumption Forecast
Source: IEA Energy and AI Report, 2025. Projection uses Base Case scenario.
1.1 Why AI Data Centers Are Different
Traditional data centers and AI data centers are fundamentally different beasts when it comes to power consumption:
Traditional Server
NVIDIA H100 GPU
NVIDIA B200 GPU
AI Server Rack (8 GPUs)
A single AI training rack with 8 NVIDIA B200 GPUs can consume 80-100 kW — equivalent to powering 80-100 typical Indonesian homes simultaneously. The counter-argument, explored in our analysis of how data centers fund grid modernization, is that this demand also drives renewable investment.
1.2 The ChatGPT Comparison
Every time you ask ChatGPT a question, you're using electricity. According to Epoch AI research:
- One ChatGPT query: ~0.3 watt-hours (Wh)
- One Google search: ~0.0003 kWh
- ChatGPT vs Google: AI queries use 10-15x more electricity
- Global ChatGPT daily usage: ~40 million kWh/day
That's equivalent to the daily electricity consumption of a city of 3 million people.
3. Southeast Asia: Ground Zero for Data Center Expansion
Southeast Asia's data center capacity is experiencing explosive growth. According to Cushman & Wakefield:
SEA Data Center Capacity: 1.68 GW (2024) → projected to exceed 7.59 GW by 2030 — a 4.5x increase in just six years.
| Country | Current Capacity (2024) | Pipeline/Announced | % of National Grid |
|---|---|---|---|
| 🇸🇬 Singapore | ~1,000 MW | +700 MW (Jurong Island) | ~7% |
| 🇲🇾 Malaysia | ~505 MW | +808 MW (→1,313 MW) | ~2% |
| 🇮🇩 Indonesia | ~300 MW | +500 MW (Digital Edge alone) | ~0.5% |
| 🇹🇭 Thailand | ~250 MW | +350 MW (BOI approved) | ~1% |
| 🇻🇳 Vietnam | ~150 MW | +10 GW (by 2028) | ~0.3% |
| 🇵🇭 Philippines | ~120 MW | Growing | ~0.5% |
Sources: Cushman & Wakefield, Arizton Research, country-specific reports. Pipeline figures include announced projects. For educational and research purposes only.
4. The Uncomfortable Truth: Who Really Pays?
This is where the controversy gets real. When data centers consume massive amounts of electricity, the costs don't stay isolated — they ripple through the entire grid system. And electricity is only part of the resource equation: the water stress crisis facing AI data centers adds another layer of environmental and social impact.
3.1 The US Warning: A Preview for Southeast Asia
In the United States, the impact is already being felt and measured. According to Senator Elizabeth Warren's investigation:
PJM Grid Region (13 US States, 67 Million People)
Consumers paid $7.7 billion in 2024-2025 for transmission upgrades driven largely by data center demand.
By 2028, average household bills projected to increase by $70/month ($840/year) due to data centers.
A Bloomberg investigation found electricity costs 267% higher in areas near significant data center activity compared to 5 years ago.
3.2 Southeast Asia Electricity Tariff Comparison
Let's examine the current electricity landscape across SEA countries:
| Country | Residential Tariff | Industrial Tariff | Recent Change | Subsidy Status |
|---|---|---|---|---|
| 🇮🇩Indonesia | IDR 1,153/kWh (~$0.072) | IDR 1,444/kWh (~$0.09) | +4.5% (2024) | Heavy subsidy (IDR 83T budget) |
| 🇲🇾Malaysia | 39.96 sen/kWh (~$0.085) | 45.62 sen/kWh (~$0.097) | +14.2% (July 2025) | Targeted subsidy reform |
| 🇸🇬Singapore | ~S$0.33/kWh (~$0.25) | Varies by contract | +5-10% (2024) | No subsidy |
| 🇹🇭Thailand | 3.99 THB/unit (~$0.11) | 4.18-4.32 THB/kWh | Capped (2025) | Ft mechanism |
| 🇻🇳Vietnam | VND 2,204/kWh (~$0.084) | VND 5,422/kWh peak (~$0.21) | +4.8% (May 2025) | Cross-subsidy system |
| 🇵🇭Philippines | PHP 13.01/kWh (~$0.23) | Varies by distributor | +6% (2025) | Universal charge |
Sources: PLN, TNB, SP Group, PEA, EVN, Meralco official tariff schedules (2025-2026). Exchange rates as of Feb 2026. For educational and research purposes only.
3.3 The Indonesian Paradox
Indonesia presents a particularly interesting case study. The government allocated IDR 83 trillion (~$5.1 billion) for electricity subsidies in 2025 to keep consumer prices low.
However, according to The Jakarta Post:
- 67.49% of subsidies are allocated to households — but inefficiently targeted
- Upper-middle class groups who don't need subsidies receive most of the benefit
- Actual electricity generation cost: IDR 1,732/kWh vs. average tariff: IDR 1,153/kWh
- The gap (~IDR 579/kWh) is covered by government subsidy
When data centers — which consume industrial-scale electricity — benefit from grid infrastructure built and subsidized for citizens, the question of fairness becomes unavoidable.
Strategic Intelligence Engine
Unlock 6 strategic inputs, 10-Year NPV analysis, regional risk matrix, resilience scorecard, and Monte Carlo simulation with 10,000 iterations.
Open Impact Calculator5. Interactive Calculator: Impact on Your Electricity Bill
Use this calculator to estimate how data center growth might impact electricity costs in your country. The model incorporates IEA growth projections, country-specific tariff structures, and infrastructure cost allocation methodologies.
Estimate how AI data center growth affects citizen electricity costs in Southeast Asia
Methodology: Calculations use IEA's 15% annual DC growth rate, country-specific capacity factors (90% for DC), average household consumption data from national statistics, and infrastructure cost allocation models based on PJM precedent (adjusted for regional grid characteristics). Tariff increase estimates assume 40% of DC infrastructure costs are passed to residential consumers through rate base adjustments.
| Country | Grid Stability | Subsidy Dependence | Regulatory | Social License | Composite |
|---|
Source: Publicly available industry data and published standards. For educational and research purposes only.
Strategic Assessment
Loading assessment...
Monte Carlo Conclusion
Loading simulation results...
Unlock Strategic Intelligence Engine
Access NPV Analysis, Regional Risk Matrix, Resilience Scorecard, and Monte Carlo Simulation with 10,000 iterations. All calculations run locally in your browser.
This calculator is provided for educational and estimation purposes only. Results are approximations based on industry benchmarks and publicly available data. They should not be used as the sole basis for investment, procurement, or engineering decisions. Always consult qualified professionals for site-specific analysis.
Algorithm & methodology sources: IEA Energy & AI Special Report 2025, Monte Carlo simulation (10K iterations), NPV 10-year analysis at 8% discount rate, 6 SEA country grid emission and tariff data, renewable energy cost projections.
All calculations are performed entirely in your browser. No data is transmitted to any server. See our Privacy Policy for details.
By using this tool you agree to our Terms. All content on ResistanceZero is independent personal research. This site does not represent any current or former employer.
6. The 15-Why Analysis: Root Causes
To understand this issue deeply, let's apply the "15-Why" methodology to trace the root causes:
Starting Point: Citizens face rising electricity bills while data centers expand
- Why are bills rising? — Utilities need to recover infrastructure investment costs
- Why invest in infrastructure? — Grid must expand to meet growing demand
- Why is demand growing so fast? — Data centers represent concentrated, unprecedented load growth
- Why do data centers need so much power? — AI computing requires massive GPU clusters running 24/7
- Why are GPUs so power-hungry? — Neural network training requires parallel processing at scale
- Why build AI infrastructure in SEA? — Lower costs, growing markets, strategic location
- Why don't data centers pay full infrastructure costs? — Traditional rate structures weren't designed for this load pattern
- Why are rate structures outdated? — Regulatory frameworks move slower than technology
- Why can't regulators keep up? — Complex stakeholder interests and political considerations
- Why are political considerations involved? — Data centers promise jobs and economic development
- Why prioritize economic development? — Countries compete for tech investment
- Why do citizens bear the cost? — Diffuse costs across many consumers are less visible than concentrated benefits
- Why is this acceptable? — Lack of transparency in utility cost allocation
- Why no transparency? — Complex technical details make public oversight difficult
- Why not simplify? — This is where advocacy and policy change must intervene
7. What Other Countries Are Doing
The backlash has begun. According to Stateline, over 60 pieces of legislation related to data center cost allocation were introduced across 22 US states in 2025.
6.1 Legislative Responses
- Texas SB 6: Mandates re-evaluation of cost allocation methodologies
- New Jersey: Requires study on whether non-DC customers subsidize data centers
- Oregon: Bill to protect residential customers from subsidizing DC demand
- Federal "Power to the People Act": Would prevent consumers from subsidizing DC development through utility bills
6.2 Singapore's Approach
Singapore took a different approach — limiting supply rather than letting the market determine outcomes:
- 2019-2022: Moratorium on new data center construction
- Post-2022: Strict sustainability requirements for new projects
- Requirement: 50% green energy sourcing, PUE ≤ 1.25
- Result: Oracle abandoned a 150MW facility after failing to secure power allocation
6.3 Malaysia's Evolving Stance
Malaysia is grappling with the tension between attracting investment and protecting consumers. According to MalaysiaNow:
"The looming electricity tariff hike sparks debate over Malaysia's love affair with power-hungry data centres"
TNB expects potential demand from data centres to reach 5,000 MW by 2035, with applications already exceeding 11,000 MW. The new July 2025 tariff structure explicitly states that "high-powered users like data centers will pay higher, cost-reflective tariffs."
8. The Fairness Question: Breaking Down the Math
Let's do the math on what "fair" might look like:
Average Indonesian Household
Pays subsidized rate + contributes to infrastructure through taxes
100 MW AI Data Center
= 648,648 Indonesian households
When that 100 MW data center connects to the grid, it requires:
- New transmission lines
- Substation upgrades
- Generation capacity additions
- Grid stability investments
These costs are typically rolled into the "rate base" and spread across all consumers. In a system where residential consumers outnumber industrial users significantly, this means ordinary families end up subsidizing infrastructure built primarily to serve data centers.
9. Recommendations: A Path Forward
8.1 For Policymakers
- Implement cost-causation pricing: Those who cause infrastructure costs should pay proportionally
- Require transparency: Publish data center electricity consumption and infrastructure cost allocation
- Set sustainability standards: Following Singapore's model — no approval without renewable commitments
- Create dedicated DC tariff classes: Malaysia's new structure is a step in the right direction
8.2 For Data Center Operators
- Self-generate with renewables: On-site solar, PPAs for wind/solar
- Invest in grid infrastructure: Co-invest in transmission assets serving DC needs
- Maximize efficiency: Every kWh saved reduces grid impact
- Transparency reporting: Publish energy consumption, efficiency metrics, renewable percentage
8.3 For Citizens
- Demand transparency: Ask utilities to break down rate increases
- Support policy reform: Advocate for cost-reflective DC tariffs
- Understand the trade-offs: Data centers bring jobs and services — the question is fair cost allocation
10. Conclusion: The Question Remains
The social media outrage asking "why are citizens told to save electricity while data centers consume megawatts?" points to a legitimate policy failure: the lack of transparent, fair cost allocation in rapidly evolving energy systems.
The data is clear:
- AI data centers consume electricity at unprecedented scales
- Infrastructure costs are being passed to residential consumers
- SEA countries are at the beginning of a massive DC buildout — one where the risk of a Southeast Asian data center bubble compounds the pressure on consumers
- Without intervention, the US pattern will repeat in Southeast Asia
"Working families, low-income households, and small businesses cannot subsidize the massive energy demands of corporate tech giants."
— Coalition for Utility Fairness
The technology isn't the problem — the policy framework is. Data centers are essential infrastructure for the digital economy. But "essential" doesn't mean "subsidized by ordinary citizens."
The conversation has begun. The question now is whether Southeast Asian policymakers will learn from the US experience — or repeat it.
Call to Action: Share this analysis. Ask your utility company how data center growth affects your rates. Demand transparency. The $30 billion flowing into SEA data centers over the next five years will reshape your electricity grid — and potentially your electricity bill. You have a right to know how.
All content on ResistanceZero is independent personal research derived from publicly available sources. This site does not represent any current or former employer. Terms & Disclaimer
References & Data Sources
- Energy demand from AI – Energy and AI International Energy Agency (IEA), 2025 — Global DC consumption: 415 TWh (2024), 945 TWh projection (2030)
- Global data center power demand to double by 2030 S&P Global, 2025 — IEA projection analysis
- APAC Data Centre Update: H1 2025 Cushman & Wakefield — SEA capacity data: 1.68 GW → 7.59 GW
- Warren Investigation into Big Tech Data Centers US Senate, 2025 — $7.7B consumer cost in PJM region
- Indonesia electricity subsidy to cost Rp 83 trillion in 2025 The Jakarta Post, 2024 — Indonesia subsidy analysis
- Electricity tariff hike sparks debate over Malaysia's data centres MalaysiaNow, 2025 — TNB 5,000 MW projection
- NVIDIA H100 Power Consumption Guide TRG Datacenters — H100: 700W TDP, B200: 1000W TDP
- How much energy does ChatGPT use? Epoch AI — ChatGPT query: ~0.3 Wh
- With electricity bills rising, some states consider new data center laws Stateline, 2026 — 60+ bills in 22 US states
- TNB Malaysia Tariff Schedule Tenaga Nasional Berhad — Official tariff rates 2025
- Vietnam Retail Electricity Tariff (May 2025) EVN — VND 2,204/kWh average rate
- Meralco Rate Updates 2025 Meralco — PHP 13.01/kWh residential rate