Table of Contents
Executive Summary
Southeast Asia's data center market is undergoing an unprecedented expansion: $37B+ committed across 6,068 MW of new capacity. Johor alone has a 5.8 GW pipeline — enough to power 4.6 million homes — in a state of 3.8 million people. Indonesia's installed capacity reached 1,717 MW with operators racing to build ahead of demand. The critical question: does committed hyperscaler demand actually materialize at the pace needed, or does the region face a Southeast Asian version of the mid-2000s fiber-optic overbuild? For the bull case counter-argument, see our companion analysis of the $37 billion SEA data center opportunity.
1. The Supply Explosion: $37 Billion and Counting
Between 2024 and 2026, Southeast Asia witnessed the largest wave of data center investment in its history. The numbers are staggering: 135 upcoming facilities joining 290 existing ones, involving 149 major operators and investors, with a combined pipeline exceeding 6 GW of IT power capacity.
| Market | Operational (MW) | Under Construction | Pipeline/Planned | Vacancy | Risk Level |
|---|---|---|---|---|---|
| Singapore | ~780 MW | Limited | ~900 MW | 2% | LOW |
| Malaysia (Johor) | 487 MW | 422 MW | 5.8 GW total | 1.1%* | CRITICAL |
| Indonesia | 1,717 MW | Active | 4,145 MW by 2031 | ~14% | MEDIUM-HIGH |
| Thailand | ~200 MW | Rapid | ~1,092 MW by 2030 | ~12% | MEDIUM |
| Vietnam | Growing | 11 facilities | 560 MW by 2030 | Low | LOW-MED |
| Philippines | ~100 MW | 13 upcoming | ~1 GW target | Moderate | MEDIUM |
*Johor vacancy at 1.1% reflects current state; pipeline absorption is the risk. Sources: Cushman & Wakefield H1 2025, ResearchAndMarkets, Arizton. For educational and research purposes only.
The math that should concern everyone: Johor's 5.8 GW pipeline is 12x its current operational capacity. Even at aggressive 20% annual absorption, it would take until 2035+ to fill. Much of this capacity is carrier-neutral and speculative — tenants not yet secured.
2. Indonesia: The 1,717 MW Frontier
Indonesia's data center market is the largest in Southeast Asia by installed capacity, reaching an estimated 1,717 MW in 2026. Jakarta retains 56.7% of national capacity, but the geography of investment is shifting rapidly toward Greater Jakarta's industrial corridors: Bekasi, Cibitung, Cikarang, and Karawang.
2.1 The Operator Landscape
Indonesia's DC market is dominated by a mix of domestic and regional players. To illustrate the competitive dynamics without commercial bias, we anonymize the operators:
| Operator | Location | Capacity | Status | Key Note |
|---|---|---|---|---|
| DC-IDX-1 (Listed) | Cibitung, Karawang, Jakarta | 119 MW (live) + 36 MW (H1'25) | Expanding | Rev +36% YoY; NI margin 54% |
| DC-Global-2 | Bekasi (Greater Jakarta) | 120 MW campus | $1B investment | AI-ready hyperscale |
| DC-Telco-3 | Multiple cities | ~150 MW (est.) | Expanding | State-owned telco subsidiary |
| DC-Regional-4 | Greater Jakarta, Batam | 500 MW planned (AI Campus) | PPAs signed | Wholesale deals 250+ MW |
| DC-US-5 | Jakarta | New entrant | $403M financing | Sustainability-linked |
| DC-Japan-6 | Greater Jakarta | Multiple facilities | Established | Enterprise + cloud focus |
Source: Publicly available industry data and published standards. For educational and research purposes only.
2.2 DC-IDX-1: The Indonesian Market Benchmark
The most visible indicator of Indonesia's DC market health is its only publicly listed pure-play data center operator, which we designate DC-IDX-1. With a portfolio spanning three campuses (Cibitung at 73 MW being the largest, Karawang at 27 MW, and Jakarta CBD at 19 MW), this operator provides the rare transparency of public financial reporting in an otherwise opaque market.
The JK6 facility at their Cibitung campus adds 36 MW of AI-ready capacity with liquid cooling support, bringing total capacity to 155 MW by mid-2025. Beyond that, the company has disclosed plans for a massive DCI-H3 in Bintan with projected capacity exceeding 1,000 MW — a tenfold increase over their current portfolio.
The question DC-IDX-1 investors should ask: Current financials are exceptional (54% net margin, triple-digit revenue growth). But the 1,000 MW Bintan ambition represents a $8-10B capex commitment over the next decade. Can a company generating ~Rp 3T annual revenue fund this without massive dilution or debt? And who are the pre-committed tenants for a 1,000 MW facility on an island?
2.3 The PLN Power Bottleneck
Jakarta's transmission backbone is near saturation, a constraint that compounds the electricity cost pressures on citizens already facing rising tariffs. Data center bookings are forecast to absorb 2,200 MW by 2030 — more than one-third of PLN's incremental substation additions. The state utility's RUPTL 2025-2034 calls for 69.5 GW of new generation, but the gap between data center demand and grid capacity is a binding constraint that could determine which projects succeed and which stall.
Greater Jakarta (covering 70% of Indonesia's DC capacity) is particularly vulnerable. Operators in Bekasi and Cikarang are already competing for limited transformer capacity, and new substations take 2-3 years to commission.
3. Johor: Boom or Bubble?
No market in Southeast Asia demands more scrutiny than Johor. The numbers are extraordinary: from a standing start of near-zero five years ago, Johor now has 487 MW of live capacity, 422 MW under construction, and a total pipeline of 5.8 GW.
Five years ago Johor was a standing start. Today 487 MW is operational — real halls, real tenants, anchored by Singapore's moratorium overflow.
Cranes on the skyline: another 422 MW is being built right now. Everything to this point is bankable capacity.
The next tier is bigger than everything built so far combined: 1.4 GW committed — land and power secured, contracts signed, but no steel yet.
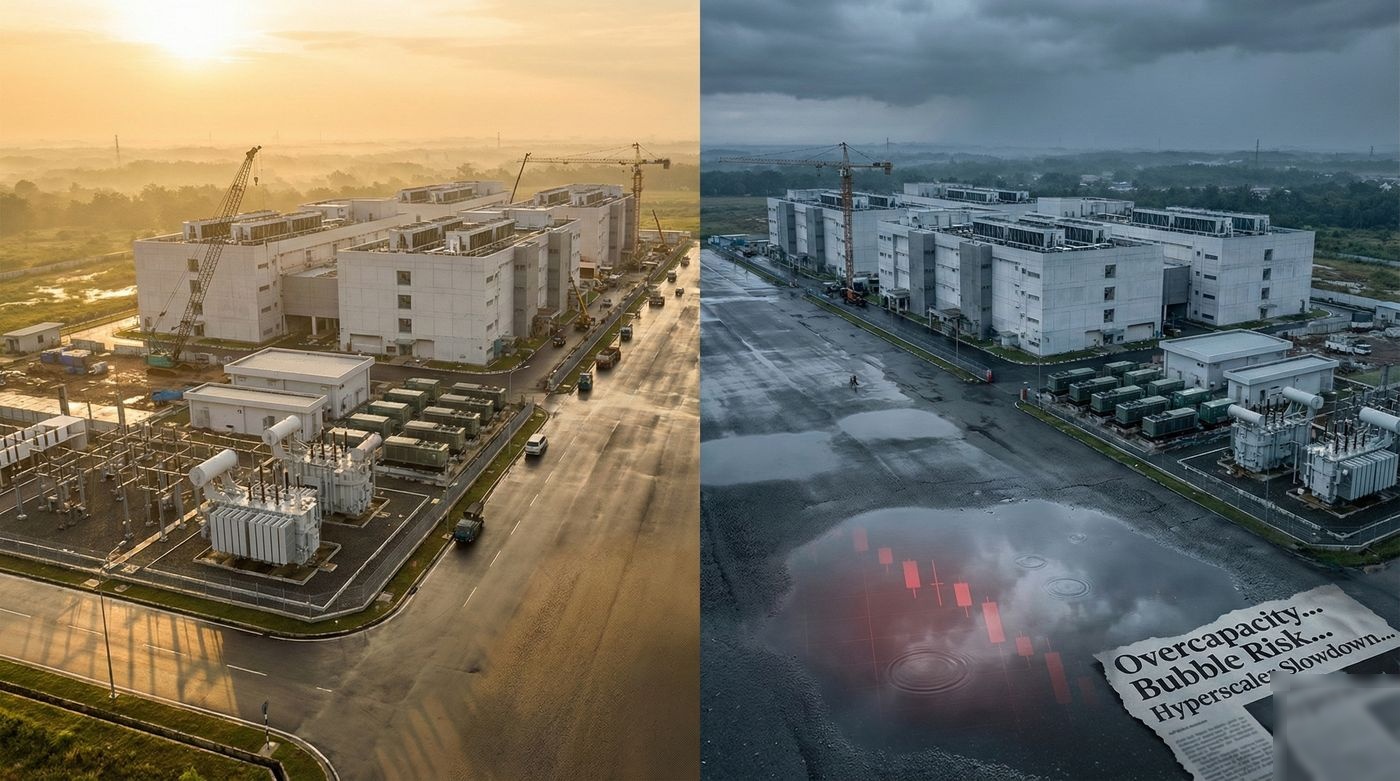
The headline number is 5.8 GW. But 3.4 GW of it exists only in early-stage planning — announcements, not assets. Whether that red bar becomes real capacity or a repeat of the 2001 telecom overbuild is the question this article weighs.
3.1 The Bull Case
Proximity to Singapore (~2ms fiber latency) makes Johor a natural overflow market for the world's tightest DC hub (2% vacancy). Land costs are a fraction of Singapore's. Hyperscaler commitments are real: Microsoft ($2.2B), AWS ($6B by 2037), Google active. Malaysia's data center capacity is set to double by end-2026 (Nikkei Asia). Current vacancy in Johor: just 1.1%.
3.2 The Bear Case
Much carrier-neutral capacity is speculative — tenants not yet secured. 3.4 GW of the 5.8 GW pipeline is early-stage projects. Power infrastructure may not keep pace: operators are having to solve their own energy problems (DayOne's 500 MW solar PPA with TNB). Sources close to the Johor state government indicate discussions about potential limits on new DC approvals, echoing the community opposition patterns already playing out from Virginia to Johor. The region risks becoming overbuilt for hyperscalers that may not come at the expected pace.
Here's the math that matters: AWS's $6B investment in Malaysia spans 15 years. That's ~$400M per year. Microsoft's $2.2B is over 4 years. These are not lump-sum capacity injections — they're gradual deployments that the 5.8 GW pipeline dramatically outpaces.
4. Building on Borrowed Promises: The Hyperscaler Dependency Trap
An estimated 60-70% of new large-scale builds (50 MW+) in SEA are build-to-suit or pre-leased to hyperscalers. The remaining 30-40% are speculative, carrier-neutral builds hoping to attract tenants post-construction. This creates a dangerous concentration of risk.
4.1 The Self-Build Trend Nobody Discusses
While colo providers build for hyperscalers, the hyperscalers themselves are quietly building their own facilities:
- Microsoft: Self-build data centers under development in Cyberjaya, Malaysia
- Google: Self-build facility in northern Kuala Lumpur
- AWS: Self-build operations across Singapore ($17B commitment)
The hyperscaler playbook is clear: use colocation for speed-to-market, then progressively shift workloads to owned infrastructure where economics favor it. Every MW of self-build capacity is a MW that won't be leased from a colo provider.
4.2 The $602 Billion Question
Hyperscaler capex is projected at $602 billion in 2026 (36% increase over 2025), with 75% directed to AI infrastructure. The Big Five now spend 45-57% of revenue on capex — ratios historically associated with overinvestment. They've raised $108 billion in debt in 2025 alone to fund this expansion.
"The projected $3 trillion in AI infrastructure investment by 2028 would rival the railroad build-out of the 1800s in scale. AI CapEx is approximately 0.9% of US GDP, compared to 4% for railways and 1.2% for telecom during their respective build-outs." — Goldman Sachs, 2026
What happens if hyperscaler capex slows? DeepSeek's R1 model — trained for allegedly $5.6M using 2,000 H800 GPUs vs. $80-100M and 16,000 H100s for comparable Western models — demonstrated that the relationship between AI capability and infrastructure demand is not linear. If efficiency improvements outpace demand growth, the SEA colo pipeline faces a brutal correction.
5. The Stranded Assets Nobody Talks About
While billions pour into new AI-ready facilities, a quieter crisis unfolds in the region's older data centers. Pre-2015 facilities designed for 5-10 kW per rack are fundamentally incompatible with modern AI workloads demanding 50-100 kW per rack.
| Metric | Legacy DC (pre-2015) | Modern AI-Ready DC | Gap |
|---|---|---|---|
| Rack Density | 5-10 kW/rack | 50-100 kW/rack | 10x |
| Cooling | Raised-floor CRAC/CRAH | DLC, Immersion | Complete redesign |
| Floor Loading | Standard (~2,000 lbs) | 5,000-8,000 lbs/rack | 4x |
| PUE | 1.8-2.5 | 1.2-1.3 | 40% less efficient |
| Power Architecture | Single-feed, basic | Dual-grid, on-site gen | Full rebuild |
Source: Publicly available industry data and published standards. For educational and research purposes only.
Legacy facilities face a dual compression: their existing enterprise tenants migrate to cloud (AWS, Azure, GCP), while hyperscaler/AI tenants exclusively target purpose-built, AI-ready facilities. Retrofitting from 5 kW to 15-20 kW/rack is feasible at ~$5-6M per MW, but reaching true AI-ready density (50+ kW/rack) is impractical in most pre-2015 buildings due to structural, electrical, and cooling limitations.
For smaller operators stuck with aging facilities, selling VPS or managed hosting services is a survival strategy, not a growth strategy. Margins have compressed 15-30% over four years, and the hyperscalers' own cloud services progressively eliminate every competitive advantage local providers once held.
The Philippines warning: SM Investments Corporation, one of the country's largest conglomerates, announced in late 2025 it was exiting the data center business entirely, citing soaring electricity costs and heightened disaster risks. When a diversified conglomerate can't make DC economics work, what chance do subscale operators have?
6. Is This a Bubble? The Historical Parallels
To answer this question honestly, we need to examine what happened before in similar infrastructure build-outs.
6.1 The Bullwhip Effect
The bullwhip effect — where supply decisions lag demand signals, causing amplified boom-bust cycles — is the most dangerous dynamic in the current market. Here's how it works in data centers:
- Demand signal: Hyperscalers announce massive AI investments (2023-2024)
- Supply response: Colo operators begin 18-36 month construction cycles (2024-2025)
- Lag period: New supply comes online 2-3 years after demand signal (2026-2028)
- Potential mismatch: If AI capex decelerates or efficiency improves, supply arrives into weakening demand (2027-2029)
Analysts at Gadallon Research explicitly warn of "periods of overcapacity and unstable pricing for multiple years" as the bullwhip unwinds, with mid-decade (2025-2026) identified as a potential inflection point. Occupancy rates are projected to peak at >95% in late 2026, followed by moderation starting 2027.
6.2 Bubble Indicators Scorecard
| Indicator | Classic Bubble Signal | SEA DC Market 2026 | Signal? |
|---|---|---|---|
| Supply outpacing demand | Construction > absorption rate | Johor: 5.8 GW pipeline, ~200 MW/yr absorption | STRONG |
| Speculative building | Building without anchor tenants | 30-40% of large builds are spec | MODERATE |
| Easy money / cheap debt | Low-cost financing fueling expansion | $2.8B (Bridge), $1B+ REIT (AirTrunk) | MODERATE |
| "This time is different" | Belief that old rules don't apply | "AI demand is insatiable" | STRONG |
| New entrants flooding in | Non-traditional players entering | Real estate, PE, sovereign funds | STRONG |
| Customer concentration | Revenue depends on few buyers | 60-70% hyperscaler dependency | STRONG |
| Demand actually materializing | Revenue growth validating investment | DC-IDX-1: +119% Q1'25 revenue | HEALTHY |
| Structural demand driver | Fundamental shift supporting growth | AI, cloud, digital transformation | HEALTHY |
Assessment: 4 strong bubble signals, 2 moderate, 2 healthy counter-signals. Verdict: selective bubble — not uniform across all markets. For educational and research purposes only.
7. Investment Analysis: The Numbers Behind the Bets
7.1 Build Economics
7.2 The Break-Even Trap
A typical 20 MW data center in Southeast Asia requires approximately 60-70% occupancy to break even on operating costs, and 80-85% occupancy to achieve the IRR targets that justify the initial investment. Here's what happens at different occupancy levels:
| Occupancy | Revenue (20 MW DC) | OPEX Coverage | Capex Payback | Status |
|---|---|---|---|---|
| 90%+ | $36-45M/yr | Full | 5-6 years | Healthy |
| 70-85% | $28-38M/yr | Full | 7-10 years | Marginal |
| 50-70% | $20-28M/yr | Partial | 10+ years | Distressed |
| <50% | <$20M/yr | Negative cash flow | Never | Failure |
Source: Publicly available industry data and published standards. For educational and research purposes only.
If vacancy rates across SEA rise by just 10-15 percentage points (from ~14% regional average to 25-30%), the revenue impact cascades: operators cut pricing to fill space, which compresses margins for everyone, which delays capex payback, which triggers covenant breaches on debt, which forces distressed sales. This is how infrastructure bubbles unwind.
8. What Happens When the Music Stops
8.1 The Correction Scenario (2027-2029)
Based on the evidence, here is the most likely correction scenario:
- Late 2026: Occupancy peaks at 95%+ as current pipeline absorbs pent-up demand
- 2027: Massive new supply comes online (Johor, Thailand, Indonesia). Vacancy begins rising
- 2027-2028: Pricing pressure as operators compete for tenants. Spec builds particularly affected
- 2028-2029: Consolidation wave. Smaller/subscale operators acquired or exit. Legacy DCs face accelerated obsolescence
- 2029-2030: Market stabilizes at new equilibrium. Survivors emerge stronger with consolidated positions
8.2 Who Survives
8.3 The Verdict
Is this a bubble? Yes — but a selective one.
This is not a uniform bubble across all SEA markets. Singapore (2% vacancy, strict government controls) is undersupplied and will remain so through 2028. Indonesia has strong domestic demand but power infrastructure constraints will self-regulate growth. Vietnam is early-stage with genuine structural demand.
The bubble is concentrated in Johor (5.8 GW for 3.8M people), parts of Thailand (20x investment jump in 6 months), and among speculative, carrier-neutral operators building without anchor tenants. The 2027-2029 correction will be real, but it will be geographic and operator-specific — not a market-wide collapse.
The infrastructure being built will eventually prove valuable. But as the fiber-optic crash of 2001 taught us: the infrastructure can be right while the investment timing is catastrophically wrong.
9. Interactive: SEA DC Bubble Risk Calculator
Model the supply-demand dynamics for any SEA market. Adjust the variables below to see how different scenarios affect bubble risk, vacancy projections, and investment outcomes.
Model supply-demand dynamics and risk exposure for any SEA market. Hover ?Hover over any ? icon for detailed explanations of each input parameter and how it affects the risk calculation. icons for parameter explanations.
Calculation Methodology & Assumptions
Supply-Demand Analysis:
- S/D RatioSupply-to-Demand Ratio. Compares total pipeline capacity against projected 5-year demand. A ratio above 1.5x typically signals oversupply risk; above 2.0x is a red flag.:
pipeline / (absorption × 5)— total pipeline divided by 5-year cumulative demand projection - Vacancy 2028: Based on 3-year absorptionAbsorption Rate is the amount of new data center capacity (MW) that gets leased/filled by tenants each year. Higher absorption = healthier market. vs 60% of new capacity expected to come online by 2028
- Pipeline/Population:
pipeline / population— MW per million people. Helps identify disproportionate builds (e.g., Johor's 1,526 MW/M vs Indonesia's 15 MW/M)
Financial Risk Metrics:
- Break-even OccupancyThe minimum occupancy rate at which a data center covers its operating expenses (OPEX). Below this threshold, the facility operates at a cash-flow loss even if it has some tenants.:
OPEX% + speculative% × 15— higher speculative builds need higher fill rates to survive - Projected Occupancy:
max(40%, 95% - S/D ratio × 15%)— oversupplied markets push average occupancy down - Revenue:
rev/MW × pipeline × occupancy— annual colocation revenue at projected fill rate - EBITDAEarnings Before Interest, Taxes, Depreciation & Amortization. The primary profitability metric for data centers. Calculated as Revenue minus Operating Expenses. Typical DC EBITDA margins: 35-45%.:
revenue × (1 - OPEX%)— operating profit before financing costs - NPVNet Present Value. The total value of future cash flows discounted back to today using the WACC. Positive NPV = the investment creates value; negative NPV = it destroys value. Accounts for the time value of money.: 10-year DCFDiscounted Cash Flow. A valuation method that projects future cash flows and discounts them to present value using a discount rate (WACC). Standard methodology for infrastructure investment analysis. with 3-year ramp-up from 30% to stabilized occupancy, discounted at WACCWeighted Average Cost of Capital. The blended cost of debt and equity financing. Represents the minimum return an investment must generate to create value. SEA infrastructure typically: 8-12%.
- Payback Period:
totalCapex / annualEBITDA— years to recover initial investment. Under 7 years = attractive; over 10 years = high risk
Bubble Risk Score (0-100):
- S/D ratio weight: 30 pts — the dominant risk factor
- Speculative build %: 25 pts — builds without tenants
- Low pre-commitment: 20 pts — lack of hyperscaler contracts
- Absorption timeline: 15 pts — penalty if >3 years to fill
- Extended payback: 10 pts — penalty if >6 years ROI
Disclaimer: This calculator provides directional estimates for educational purposes. Actual investment decisions require detailed feasibility studies, site-specific analysis, and professional advisory.
All content on ResistanceZero is independent personal research derived from publicly available sources. This site does not represent any current or former employer. Terms & Disclaimer
References & Sources
- ResearchAndMarkets, "South East Asia Colocation Data Center Portfolio Report 2025-2029," January 2026. globenewswire.com
- Arizton, "Southeast Asia Data Center Colocation Market Supply & Demand Analysis 2025-2030." yahoo.com
- Cushman & Wakefield, "APAC Data Centre H1 2025 Update." cushmanwakefield.com
- Data Center Dynamics, "The Past, Present, and Future of Johor." datacenterdynamics.com
- Nikkei Asia, "Malaysia's data center capacity set to double by end-2026." nikkei.com
- CBRE, "Asia Pacific Data Centre Trends & Opportunities 2026." cbre.com
- IndoPremier, "DCII Targetkan Data Center JK6 Cibitung Beroperasi Semester I 2025." indopremier.com
- IDNFinancials, "DCII prepares IDR 1 trillion to boost data centre capacity." idnfinancials.com
- Goldman Sachs, "Why AI Companies May Invest More than $500 Billion in 2026." goldmansachs.com
- IEEE ComSoc, "Hyperscaler CapEx >$600B in 2026." comsoc.org
- Gadallon Research, "AI's Great Infrastructure Boom: Bullwhip or Building the Future?" substack.com
- GlobeNewsWire, "Indonesia Data Center Industry Report 2026." globenewswire.com
- Mordor Intelligence, "Indonesia Data Center Market Size & Share 2031 Outlook." mordorintelligence.com
- Data Center Knowledge, "Retrofitting Legacy Data Centers for AI Hardware." datacenterknowledge.com
- Eco-Business, "High costs, higher risks: Can the Philippines power its data centre hub ambitions?" eco-business.com
- Introl, "Hyperscaler CapEx Hits $600B: The AI Infrastructure Debt Wave." introl.com
- KR-Asia, "Malaysia's data center boom: An inside look at Asia's battle for AI supremacy." kr-asia.com