1 Revenue Ranking Methodology
This catalog ranks 120 data center services by their Annual Revenue Potential (ARP) — a composite metric developed from analysis of industry pricing data from CBRE, Cushman & Wakefield, JLL, and Uptime Institute benchmarks. The ARP considers not just the unit price, but the volume of engagements, total addressable market, and whether the revenue is recurring or one-time.[1]
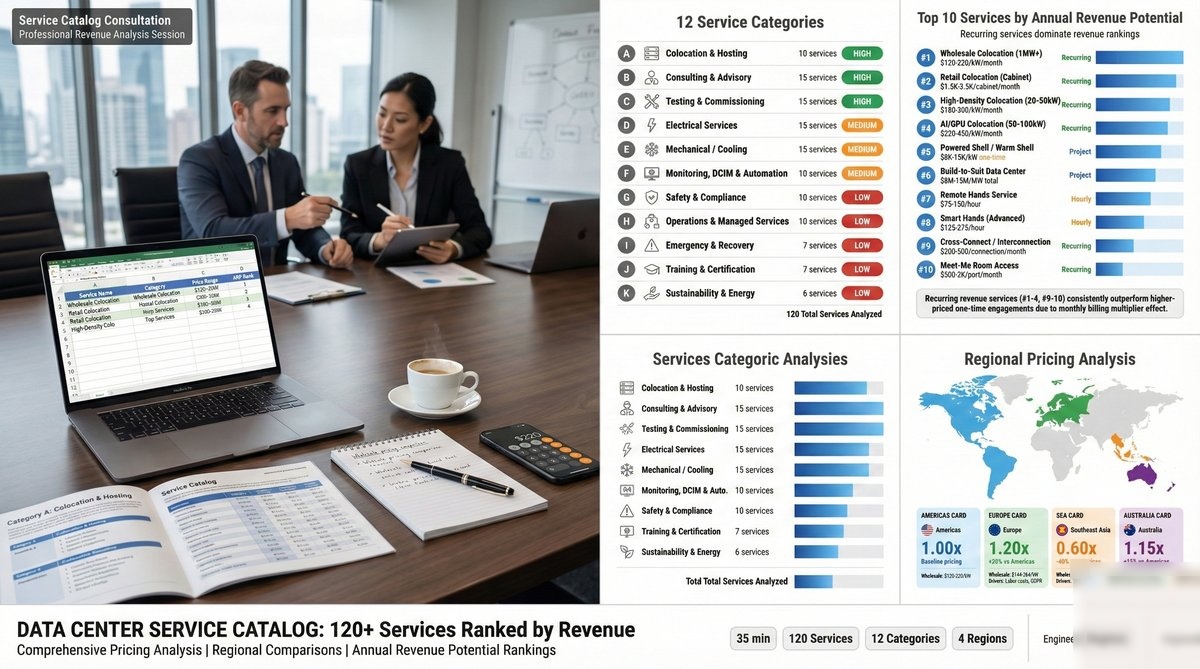
Services are ranked #1 (highest ARP) through #135 (lowest ARP). Each service is also tagged with a revenue category:
Rank #1–40
Rank #41–80
Rank #81–120
2 Category A: Colocation & Hosting (#1–10)
Colocation and hosting services form the foundation of data center revenue, representing approximately 65–75% of total industry revenue globally.[2] These recurring, high-volume services dominate the top ranks due to their monthly billing model and large addressable market. The global colocation market reached $63.5 billion in 2025 and is projected to exceed $100 billion by 2028, driven by hyperscaler expansion and AI workload growth — particularly in Southeast Asia, where the $37 billion opportunity is reshaping regional service demand.[3]
Wholesale colocation (1MW+) commands the #1 rank because a single 5MW deal at $120–220/kW/month generates $7.2M–$13.2M annual recurring revenue. The rise of AI/GPU colocation has introduced a premium tier: purpose-built facilities with liquid cooling infrastructure command 30–60% premiums over traditional colocation.
A — Colocation & Hosting
Rank #1–10 | Highest Revenue3 Category B: Consulting & Advisory (#11–25)
Advisory services command premium pricing ($15K–$500K per engagement) but are typically project-based. The data center consulting market was valued at $9.8 billion in 2025, growing at 12% CAGR as operators navigate increasingly complex design decisions around AI readiness, sustainability mandates, and regulatory compliance.[4]
Master planning and feasibility studies drive the highest revenue within this category. A campus-scale master plan for a 100MW+ development can command $250K–$500K, while Tier Certification consulting is a high-margin niche requiring specialized expertise. Due diligence assessments for M&A transactions have surged as the sector consolidates — over $45 billion in DC transactions closed in 2024 alone.[5]
B — Consulting & Advisory
Rank #11–25 | High Revenue4 Category C: Testing & Commissioning (#26–40)
Testing and commissioning (T&C) services are critical for new builds and major upgrades. With global data center construction spending exceeding $350 billion annually by 2027, the commissioning pipeline is massive.[6]
IST engagements generate the highest revenue at $50K–$150K per MW of commissioned capacity. A typical 20MW data hall IST program runs $1M–$3M including all sub-tests. FAT and SAT activities generate $10K–$30K per event but occur in high volume across multi-phase builds.
C — Testing & Commissioning
Rank #26–40 | High Revenue5 Category D: Electrical Services (#41–55)
Electrical maintenance and engineering services are the backbone of facility reliability. Annual maintenance contracts for HV/MV switchgear, UPS systems, and generators provide predictable recurring revenue streams, while emergency repairs command 2–3x premium pricing due to urgency.
A typical 10MW data center spends $400K–$800K annually on electrical maintenance alone — costs driven by the increasingly complex power distribution architectures that hyperscalers are now deploying.[7] Arc flash studies ($15K–$40K per facility) are required by NFPA 70E and must be updated every 5 years or after any significant electrical modification. EPMS deployment ($50K–$150K) is increasingly bundled with maintenance contracts.
D — Electrical Services
Rank #41–55 | Medium Revenue6 Category E: Mechanical / Cooling (#56–70)
Mechanical and cooling services are the fastest-evolving category as rack densities climb from traditional 5–8 kW to 40–100+ kW for AI/GPU workloads. The data center cooling market reached $22.5 billion in 2025 and is growing at 14% CAGR.[8]
CRAH/CRAC maintenance remains the volume leader, but liquid cooling system maintenance (direct-to-chip, rear-door heat exchangers, immersion) is the growth driver. Chiller plant maintenance at $8K–$25K per chiller/year represents the highest per-unit spend. BMS controls optimization ($15K–$40K) delivers measurable ROI: a well-tuned BMS can reduce cooling energy consumption by 15–25%.
E — Mechanical / Cooling
Rank #56–70 | Medium Revenue7 Category F: Monitoring, DCIM & Automation (#71–80)
DCIM and monitoring services bridge the gap between physical infrastructure and digital operations. The DCIM market is projected to reach $5.4 billion by 2028, driven by the need for real-time visibility into increasingly dense and complex facilities.[10]
Full DCIM implementation ($100K–$500K) is a high-value engagement that creates long-term lock-in — once deployed, clients rarely switch platforms. SCADA upgrades and NOC monitoring services ($5K–$20K/month) provide high-margin recurring revenue. Alarm rationalization ($15K–$40K) has emerged as a critical service — the average data center generates 3,000–10,000 alarms per day, of which 85–95% are actionable noise.[11]
F — Monitoring, DCIM & Automation
Rank #71–80 | Medium Revenue8 Category G: Safety & Compliance (#81–90)
Compliance and certification services are driven by regulatory requirements, insurance mandates, and customer due diligence demands. The three most requested certifications are: Uptime Tier, ISO 27001, and SOC 2 Type II.
Uptime Institute reports over 3,100 active Tier certifications globally, with 400+ new certifications annually.[12] Full Tier certification support ($50K–$150K) is highly specialized work requiring certified ATD professionals. SLO licensing support is critical in regulated markets like Indonesia, where operating without proper electrical permits carries severe penalties.
G — Safety & Compliance
Rank #81–90 | Low Revenue9 Category H: Operations & Managed Services (#91–100)
Managed services transform one-time engagements into long-term partnerships with typical contract terms of 3–5 years. Full facility operations management at $15–$30/kW/month may appear as "low" per-unit pricing, but scales massively: a 10MW facility generates $1.8M–$3.6M annually from operations management alone.
CMMS operation ($5K–$15K/month) and vendor management ($3K–$10K/month) are high-margin services with strong retention. MOC and RCA services are priced per-event but are essential for maintaining operational discipline. Embedded shift staffing ($8K–$15K per FTE/month) is the largest volume driver in this category.
H — Operations & Managed Services
Rank #91–100 | Low Revenue10 Category I: Emergency & Recovery (#101–107)
Emergency services carry the highest gross margins (60–80%) in the entire catalog due to urgency premiums and the critical nature of the work. A single unplanned data center outage costs an average of $9,000 per minute according to Uptime Institute's 2024 survey — making rapid response services extremely valuable.[13]
The retainer model ($5K–$15K/month) is the foundation: clients pay for guaranteed response times (typically 2–4 hour SLA) and on-call engineering resources. Temporary power deployment ($3K–$10K/day) and DR site activation ($50K–$200K per event) are the highest-value emergency engagements. Post-incident forensic investigation ($15K–$50K) builds deep trust and often leads to long-term retainer contracts.
I — Emergency & Recovery
Rank #101–107 | Low Revenue11 Category J: Training & Certification (#108–114)
Training services have lower per-unit pricing ($500–$4,000 per attendee) but scale effectively through group sessions. A 20-person NFPA 70E training session generates $10K–$30K per event. The data center workforce gap is widening: the industry needs an estimated 300,000 additional skilled workers by 2030, making training services a structural growth market.[14]
CDFOM and ATD certification preparation ($2K–$4K per attendee) carry premium positioning because they lead to formal industry certifications. Emergency response tabletop exercises ($5K–$15K per event) are increasingly required by insurance underwriters on an annual basis, creating predictable recurring demand.
J — Training & Certification
Rank #108–114 | Low Revenue12 Category K: Sustainability & Energy (#115–120)
Sustainability services are the fastest-growing category at 25–30% CAGR, driven by ESG mandates, EU Energy Efficiency Directive requirements, and corporate net-zero commitments. Over 85% of major data center operators have published sustainability targets for 2030, creating massive demand for advisory and implementation services.[15]
PPA advisory ($30K–$100K per project) is the highest-value sustainability service, as operators seek to lock in renewable energy at competitive rates. Carbon footprint assessments (Scope 1, 2, 3) and WUE optimization are growing rapidly as reporting requirements tighten. LEED certification support ($25K–$75K) adds measurable property value: LEED-certified facilities command 5–10% rent premiums.
K — Sustainability & Energy
Rank #115–120 | Low RevenueUnlock Pro OPEX & Workforce Intelligence
Go beyond service pricing. Model annual OPEX, optimize staffing, assess financial risk, and generate executive reports with Monte Carlo simulation — all client-side, no data leaves your browser.
13 Interactive Service Catalog Calculator
Use this interactive tool to explore all 120 services, filter by category and region, and build a custom service quote with regional pricing comparisons.
Strategic OPEX Parameters
14 Regional Pricing Analysis
Data center service pricing varies significantly across global regions, driven by labor costs, regulatory complexity, market maturity, and supply/demand dynamics. The following multipliers are derived from BLS labor cost indices, ILO international data, and commercial real estate benchmarks from CBRE and JLL across 15+ data center markets.[1]
SEA (0.60x): Lower labor costs in Indonesia, Malaysia, and Thailand significantly reduce service pricing. However, the gap is narrowing as the region matures and demand from hyperscalers drives up skilled labor rates.
Australia (1.15x): High labor costs and geographic isolation push pricing 15% above baseline. The concentrated market (primarily Sydney and Melbourne) supports premium positioning.
15 Conclusion & Revenue Strategy
Strategic Revenue Optimization Framework
This comprehensive catalog of 120 data center services reveals several critical patterns for revenue optimization:
- Recurring beats one-time: Monthly colocation and managed services generate the highest ARP despite lower unit prices. Prioritize building recurring revenue streams.
- Bundle for value: Combining complementary services (e.g., colocation + remote hands + monitoring) increases per-customer revenue by 40–60% while improving retention.
- Regional arbitrage: Deliver high-value consulting and design services from lower-cost regions (SEA) to higher-priced markets (Europe/Australia) to maximize margins — though understanding the market risks of the SEA data center boom is essential for regional pricing strategies.
- Sustainability premium: ESG-related services (Category K) are growing at 25–30% annually. Early positioning in PPA advisory and carbon assessment creates competitive moats.
- Emergency readiness: While emergency services (Category I) rank lower in volume, they carry 60–80% gross margins and build deep client relationships.
The most successful data center service providers will master the balance between high-volume recurring services and high-margin specialized engagements, while expanding regionally to capture market-specific opportunities.
16 References & Sources
All pricing ranges in this catalog are derived from analysis of the following industry sources, benchmarking reports, and market data. Prices represent Americas baseline as of Q1 2026. Actual pricing varies by scope, complexity, vendor, and specific market conditions.
- CBRE Data Center Solutions — "North American Data Center Report H2 2025: Pricing, Supply, and Demand Trends." CBRE Research, 2025. cbre.com/insights
- Cushman & Wakefield — "Global Data Center Market Comparison 2025." Includes colocation pricing, vacancy rates, and absorption across 40+ markets. cushmanwakefield.com/insights
- Structure Research — "Global Colocation Market Report 2025." Market sizing, revenue projections, and regional growth analysis. Published Q1 2025.
- McKinsey & Company — "Investing in the Rising Data Center Economy," January 2023. Advisory market sizing and growth projections for infrastructure consulting.
- Synergy Research Group — "Data Center M&A and Leasing Tracker 2024." Transaction volumes, deal values, and market consolidation analysis.
- JLL Research — "Data Center Outlook 2025: Construction Pipeline and Capital Investment." Global construction spending and commissioning pipeline analysis. jll.com/research
- Schneider Electric — "White Paper 37: Electrical Efficiency Modeling of Data Centers." OPEX benchmarks for electrical maintenance across facility sizes. 2024 revision.
- IEA (International Energy Agency) — "Data Centres and Data Transmission Networks." Energy consumption, cooling market projections, and efficiency benchmarks. iea.org
- ASHRAE — "Guideline 12-2024: Managing the Risk of Legionella in Building Water Systems." Water treatment ROI analysis and compliance requirements.
- Verdantix — "Green Quadrant: DCIM Software 2025." Market sizing and vendor analysis for DCIM and monitoring platforms.
- Uptime Institute — "Annual Outage Analysis 2024: The Causes and Costs of Data Center Disruptions." Alarm management best practices and outage cost analysis. uptimeinstitute.com
- Uptime Institute — "Tier Certification Database and Annual Report 2025." Global certification statistics, trends, and compliance analysis.
- Uptime Institute — "Uptime Institute Global Data Center Survey 2024." Cost of outages, staffing trends, and operational maturity metrics.
- Uptime Institute — "Data Center Staffing Forecast 2025–2030." Workforce gap analysis and training market projections.
- S&P Global — "Data Center ESG and Sustainability Tracker 2025." Corporate sustainability targets, PPA adoption rates, and ESG reporting requirements across operators.
- European Commission — "EU Energy Efficiency Directive (EED) Recast 2023." Waste heat reuse mandates for data centers above 1MW effective 2025. energy.ec.europa.eu
Methodology note: Regional multipliers (Americas 1.00x, Europe 1.20x, SEA 0.60x, Australia 1.15x) are derived from labor cost indices (Bureau of Labor Statistics, ILO), commercial real estate benchmarks (CBRE, JLL), and regulatory compliance overhead analysis across 15+ data center markets.

All content on ResistanceZero is independent personal research derived from publicly available sources. This site does not represent any current or former employer. Terms & Disclaimer
— End of Article 15 —
All pricing data represents Americas baseline ranges as of Q1 2026. Actual pricing varies by scope, complexity, and vendor.