Table of Contents
1. Abstract
The rapid expansion of AI infrastructure has created an unprecedented demand for data center capacity. However, this growth comes with a hidden cost that few are discussing openly: water consumption. A typical data center uses millions of gallons of water annually for cooling, and the majority of these facilities are located in regions already facing water stress.
This article examines the water stress crisis facing data centers globally, with a specific focus on Southeast Asia and Indonesia. As Jakarta and Bekasi emerge as major data center hubs—with Digital Edge's US$4.5 billion, 500MW campus leading the charge[4]—understanding and mitigating water consumption becomes a critical operational imperative.
"The proportion of data centers in water-stressed regions is at a record high. The problem has been years in the making, and some tech companies are trying to find ways to address it without creating other environmental drawbacks."
Data Validity Notice
The water stress indices, market data, and infrastructure statistics presented in this article are based on publicly available data as of February 2026. Water stress conditions are dynamic and influenced by seasonal variations, climate change, urban development, and policy changes. Readers are advised to consult the latest WRI Aqueduct data and local environmental agencies for current assessments before making infrastructure investment decisions.
Calculate Your Facility's Water Footprint
Estimate annual water consumption and compare mitigation strategies across 8 Southeast Asian regions
Open Water Calculator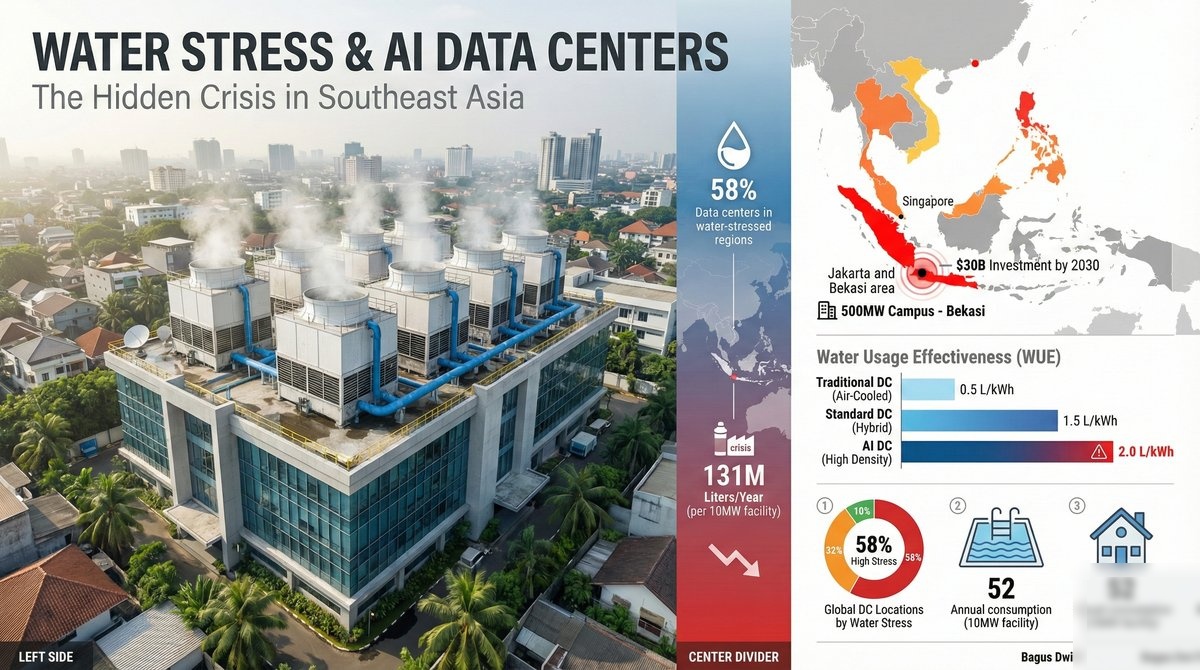
2. The Global Water Stress Landscape
Water stress = ratio of total water withdrawals to available renewable surface and groundwater supplies. Source: WRI Aqueduct 4.0[2]
According to the World Resources Institute (WRI) Aqueduct 4.0 Dataset, the majority of existing data centers in Asia are located in areas of high water stress. This critical finding raises questions about the ongoing viability of these facilities as water scarcity intensifies.
Critical Finding: Market forecasts predict data center investment in Southeast Asia could reach $30 billion by 2030.[3] The majority of announced capacity targets water-stressed regions (Jakarta, Singapore). However, as the chart above illustrates, emerging markets like Johor Bahru, Hanoi, and Da Nang offer significantly lower water stress with developing infrastructure—presenting a diversification opportunity.[2]
3. AI's Insatiable Thirst: The Cooling Challenge
The rise of AI workloads has fundamentally changed data center cooling requirements, as explored in depth in our HVAC shock analysis of AI-era cooling demands. Traditional air-cooled facilities operated at rack densities of 8-12 kW. Modern AI facilities require 25-40 kW per rack—and often much more for GPU-dense configurations.
2.1 Why AI Uses More Water
- Higher heat density: A single NVIDIA H100 GPU generates 700W of heat.[9] A rack of 8 GPUs produces 5.6 kW from GPUs alone
- Continuous operation: AI training workloads run 24/7 at maximum utilization, unlike burst compute patterns
- Liquid cooling adoption: Above 25 kW per rack, liquid or hybrid cooling becomes essential—and evaporative cooling systems consume significant water
- Scale effects: A 100MW AI data center can consume 1-2 billion liters of water annually — and the electricity bills to power that consumption add another dimension to the resource challenge
2.2 Water Usage Effectiveness (WUE)
Industry standard WUE ranges from 0.5 to 2.0 L/kWh. The formula is straightforward:
WUE = Annual Water Consumption (Liters) / IT Equipment Energy (kWh)
A typical 10MW facility with WUE of 1.5 consumes approximately 131 million liters annually—equivalent to 52 Olympic swimming pools.
4. Interactive: Data Center Water Consumption Calculator
Use this calculator to estimate water consumption based on facility parameters. Adjust the sliders to see real-time impact analysis:
Executive Water Risk Report
Why Jakarta's Water Stress Threatens New Data Center Builds
5. Southeast Asia Focus: Jakarta and Bekasi
Indonesia's data center market is experiencing explosive growth, with Jakarta emerging as Southeast Asia's fastest-growing data center market.[5] However, this growth is concentrated in one of the region's most water-stressed areas.
4.1 The Bekasi Paradox
According to BAPPENAS (Indonesian National Development Planning Agency) data, the Bekasi Regency has a population of approximately 3.1 million people as of 2023.[10] Research published in the Indonesian Journal of Geography documented a 43% increase in built-up areas in the Bekasi River Basin between 1990 and 2018.[11] Major flood events recorded by BNPB (National Disaster Management Agency) in 2020, 2021, and 2024 have affected over 100,000 residents.[12] Paradoxically, this flooding-prone area also faces severe water stress during dry seasons due to groundwater over-extraction and industrial demand.
Note: Data compiled from publicly announced projects and industry reports. Investment figures where available are from company press releases.
| Project | Location | Capacity | Investment | Water Stress[2] |
|---|---|---|---|---|
| DC1 - Hyperscaler Campus | Bekasi (GIIC) | 500 MW | US$4.5B | High |
| DC2 - Enterprise Campus | Bekasi (Cikarang) | 150 MW | US$1.2B | High |
| DC3 - Colocation Facility | Jakarta (Cibitung) | 80 MW | US$600M | High |
| DC4 - Cloud Provider | Bekasi (Deltamas) | 200 MW | US$1.8B | High |
| DC5 - Regional Hub | Jakarta (Marunda) | 120 MW | US$900M | High |
| Note: Project names anonymized for privacy. Data compiled from public announcements and industry reports. Water stress levels based on WRI Aqueduct 4.0 baseline indicators for the Jakarta-Bekasi corridor. | ||||
Source: Company announcements, industry reports, WRI Aqueduct[2] For educational and research purposes only.
4.2 Water Conservation Strategies in Bekasi
Major data center developments in the Bekasi corridor are implementing various water conservation measures:
- Direct-to-chip liquid cooling: Reduces reliance on evaporative cooling towers
- Recycled water systems: Reduces municipal water dependency
- Rainwater harvesting: Captures seasonal precipitation for cooling use
- Closed-loop systems: Minimizes water loss from evaporation
6. Regional Innovations: Learning from Neighbors
5.1 Singapore's STDCT Initiative
Launched in 2023, Singapore's Sustainable Tropical Data Centre Testbed (STDCT) is the world's first full-scale facility focused on tropical data center cooling. The collaboration between NUS, NTU, and 20 industry partners aims to reduce energy and water consumption by up to 40%.
5.2 Malaysia's Recycled Water Scheme
In Malaysia, AirTrunk has partnered with Johor Special Water (JSW) to develop the country's largest recycled water supply scheme for data centers. This model could be replicated across the region.
Key Regional Innovations
Singapore STDCT: 40% reduction target for energy and water consumption
Malaysia AirTrunk: Largest recycled water scheme for data centers in SEA
Indonesia Digital Edge: Direct-to-chip cooling with recycled water systems
7. Emerging Opportunities: Underutilized Markets in Southeast Asia
While Jakarta, Singapore, and Kuala Lumpur dominate headlines, several SEA markets offer compelling alternatives with lower water stress, favorable demographics, and untapped potential. A balanced regional strategy should consider these emerging hubs.
6.1 Vietnam: The Rising Digital Tiger
Hanoi presents a striking contrast to the saturated southern markets. With water stress indices around 15-22%, abundant Red River basin resources, and a growing tech-savvy workforce of 97 million people, northern Vietnam offers significant headroom for expansion. The government's National Digital Transformation Program targets 100,000 ICT enterprises by 2030.
Da Nang, positioned as Vietnam's "Silicon Valley of the East," benefits from cooler coastal climates (reducing cooling loads), water stress below 18%, and proximity to submarine cable landing stations. The city's infrastructure utilization remains under 40%, presenting a green-field opportunity.
Vietnam Opportunity: Combined data center capacity in Hanoi and Da Nang is currently under 50MW, compared to 500MW+ planned for Ho Chi Minh City alone. Early movers can secure favorable power purchase agreements and water rights.
6.2 Malaysia: Beyond Kuala Lumpur
Johor Bahru and the Iskandar Malaysia economic zone represent perhaps SEA's most balanced opportunity. Water stress indices of 15-20% (significantly lower than Singapore's 72%), combined with:
- Geographic advantage: 1km from Singapore via causeway, enabling low-latency connectivity to the Lion City's financial hub
- Cost efficiency: Land costs 60-70% lower than Singapore; electricity rates competitive
- Water security: Access to Johor River basin with established recycled water infrastructure
- Digital investment incentives: Malaysia Digital Economy Blueprint offers tax holidays and grants
Penang in northern Malaysia, traditionally known for electronics manufacturing, is emerging as a secondary data center hub with water stress around 25% and established industrial power infrastructure.
6.3 Philippines: Diversifying Beyond Metro Manila
Metro Manila's 35% water stress index masks significant regional variations. Clark Freeport Zone and Cebu offer alternatives:
- Clark: Former US air base with abundant land, dedicated power infrastructure, and water stress indices around 20-25%
- Cebu: Philippines' second city with growing fiber connectivity, water stress under 22%, and a BPO talent pool of 150,000+ professionals
- Batangas: Southern Luzon industrial corridor with direct submarine cable access and developing water recycling infrastructure
6.4 Indonesia: Alternatives to the Jakarta Corridor
While Bekasi and Jakarta command the largest investments, Indonesia offers diversification opportunities:
- Batam: Free trade zone with Singapore proximity (45 minutes by ferry), water stress around 30%, and duty-free equipment imports
- Surabaya: Indonesia's second city serving East Java's 40 million population, with developing data center ecosystem and moderate water stress (35%)
- Nusantara (New Capital): Indonesia's planned capital city in East Kalimantan presents a long-term opportunity with greenfield infrastructure and lower water stress projections (25-30%)
6.5 Thailand: The Central Hub
Beyond Bangkok's 38% water stress, Chonburi in the Eastern Economic Corridor (EEC) offers:
- Water stress indices around 28%, lower than the capital
- Dedicated data center power substations
- Tax incentives under Thailand 4.0 digital economy initiative
- Proximity to Laem Chabang port for equipment logistics
| Location | Country | Water Stress | Current Utilization | Key Advantage |
|---|---|---|---|---|
| Johor Bahru | Malaysia | 18% | ~35% | Singapore proximity + low cost |
| Hanoi | Vietnam | 22% | ~25% | 97M population, tech workforce |
| Da Nang | Vietnam | 18% | ~20% | Submarine cables, cool climate |
| Clark | Philippines | 25% | ~30% | Land availability, power infra |
| Batam | Indonesia | 30% | ~40% | Free trade zone, SG proximity |
| Chonburi (EEC) | Thailand | 28% | ~45% | Tax incentives, port access |
Source: WRI Aqueduct 4.0, industry reports, author analysis. Utilization estimates based on announced vs operational capacity. For educational and research purposes only.
Strategic Insight
A diversified SEA data center portfolio balancing high-demand markets (Jakarta, Singapore) with emerging low-stress locations (Johor Bahru, Hanoi, Da Nang) can achieve both performance requirements and sustainability goals — particularly when considering the grid modernization value that data centers bring to host regions. The optimal strategy considers:
1. Latency tiers: Primary workloads in established hubs, disaster recovery in emerging markets
2. Water portfolio: Balance water-intensive cooling in low-stress regions, advanced cooling tech in stressed areas
3. Risk distribution: Regulatory, climate, and infrastructure diversification across ASEAN
8. Mitigation Strategies for Water-Stressed Operations
7.1 Immediate Actions
- Implement WUE monitoring: You cannot manage what you don't measure
- Optimize cooling tower cycles: Increase concentration ratios to reduce blowdown
- Deploy leak detection: Even small leaks compound to significant losses annually
- Review setpoint temperatures: Raising supply temperatures reduces cooling demand
7.2 Medium-Term Investments
- Transition to air-side economization: Use free cooling when ambient conditions permit
- Install rainwater collection: Particularly valuable in tropical climates with consistent rainfall
- Deploy liquid cooling for high-density racks: Direct-to-chip cooling eliminates evaporative losses
- Implement water recycling: Treat and reuse cooling tower blowdown
7.3 Strategic Decisions
- Site selection: Consider water stress in location decisions, not just power availability
- Technology choices: Prioritize air-cooled or closed-loop liquid systems for new builds
- Community engagement: Partner with local water utilities on supply security
- Climate modeling: Design for 2050 water conditions, not just today's averages
9. Conclusion: Reframing the SEA Data Center Narrative
The convergence of AI growth, energy demand, and water scarcity creates both challenges and opportunities for data center operators across Southeast Asia. While Jakarta and Bekasi exemplify the tension of rapid investment in water-stressed regions, the broader SEA landscape offers a more nuanced picture.
8.1 The Balanced Perspective
This analysis reveals that SEA is not uniformly water-stressed. The region offers a spectrum of options:
- High-demand, high-stress markets (Jakarta, Singapore): Require advanced water conservation technologies but offer established ecosystems and connectivity
- Emerging, low-stress alternatives (Johor Bahru, Hanoi, Da Nang): Provide sustainable expansion opportunities with favorable water conditions
- Transitional markets (Bangkok, Manila, Kuala Lumpur): Balance moderate stress with mature infrastructure
8.2 The Path Forward
The data center industry in Southeast Asia stands at an inflection point. The decisions made in 2026-2030 will determine whether the region's digital infrastructure becomes part of the water crisis or part of the solution. Key imperatives include:
- Portfolio diversification: Spreading capacity across water stress profiles reduces systemic risk
- Technology adoption: Liquid cooling, recycled water, and free cooling must become standard, not premium
- Transparency: Water Usage Effectiveness (WUE) reporting should match the scrutiny given to PUE
- Community partnership: Data centers must be water stewards, not just consumers
"Water-resilient data centres can drive Asia's digital economy. But this requires moving beyond treating water as an infinite resource. Every liter consumed must be measured, managed, and minimized. The good news is that Southeast Asia offers the geographic diversity to build sustainably—if we're willing to look beyond the established hubs."
The solutions exist—from Singapore's tropical cooling research to Malaysia's recycled water schemes, from Vietnam's emerging green-field opportunities to Indonesia's geographic diversification options. The question is no longer whether sustainable data center growth is possible in SEA, but whether the industry will embrace the regional diversity that makes it achievable.
Final Thought: The $30 billion investment flowing into SEA data centers over the next five years represents an unprecedented opportunity to build digital infrastructure that respects planetary boundaries. Water stress is a constraint, but it's also a catalyst for innovation. The operators who master water efficiency in tropical, water-stressed environments will have a competitive advantage as these challenges become global.
This calculator is provided for educational and estimation purposes only. Results are approximations based on industry benchmarks and publicly available data. They should not be used as the sole basis for investment, procurement, or engineering decisions. Always consult qualified professionals for site-specific analysis.
Algorithm & methodology sources: WRI Aqueduct 4.0 water stress data, ASHRAE TC 9.9 thermal guidelines, WUE/PUE industry metrics, IEA World Energy Outlook 2025, regional water pricing models, evaporative cooling efficiency curves.
All calculations are performed entirely in your browser. No data is transmitted to any server. See our Privacy Policy for details.
By using this tool you agree to our Terms. All content on ResistanceZero is independent personal research. This site does not represent any current or former employer.
All content on ResistanceZero is independent personal research derived from publicly available sources. This site does not represent any current or former employer. Terms & Disclaimer
References & Data Sources
- Beneath the Surface: Water Stress in Data Centers S&P Global Sustainable1, 2024 — Analysis of 58% water stress statistic
- Aqueduct 4.0 Water Risk Atlas World Resources Institute, 2024 — Baseline water stress indicator methodology
- Will Asian AI Ambitions Be Constrained by Water Resources? Planet Tracker, 2024 — $30B SEA investment projection
- Digital Edge to Develop 500 MW Data Center Campus in Indonesia Data Center Knowledge, 2024 — Bekasi CGK Campus details
- Jakarta Emerges as Southeast Asia's Fastest-Growing Data Center Market DataCenters.com, 2024 — Market growth analysis
- AI, Data Centers, and Water Brookings Institution, 2024 — Water usage effectiveness standards
- How Much Water Do AI Data Centers Really Use? Undark Magazine, Dec 2025 — GPU heat generation data
- Water Resilient Data Centres Can Drive Asia's Digital Economy GovInsider Asia, 2024 — Singapore tropical cooling research
- NVIDIA H100 Tensor Core GPU Specifications NVIDIA Corporation, 2024 — 700W TDP specification
- Proyeksi Penduduk Indonesia (Population Projection) BPS-Statistics Indonesia, 2023 — Bekasi Regency population data
- Rustiadi, E., et al. "Land Use Changes and Urban Sprawl in Bekasi Regency" Indonesian Journal of Geography, Vol. 52, No. 2, 2020 — 43% built-up area increase (1990-2018)
- BNPB Disaster Database (DIBI) Badan Nasional Penanggulangan Bencana, 2024 — Flood event records for Bekasi
- Understanding Water Usage Effectiveness (WUE) Industry standard: WUE = Annual Water Consumption (L) / IT Energy (kWh)